NIFA Reporting System
Company: Booz Allen Hamilton | Date: September 2021 - April 2024
Client: United States Department of Agriculture
Booz Allen Hamilton was contracted with USDA to work with the National Institute for Food and Agriculture (NIFA) to develop, implement, and continually update a reporting system for Land Grant Universities within the United States to report on the research projects funded by the United States.
Role: Lead UX Designer, Design Manager, UX Strategist
Technology used: Axure, Sketch, Invision, Mural, Adobe Illustrator
Background
Universities across the United States that were granted land by the US Government also apply and receive additional funding for Public Good research projects. These universities have submit several reports yearly that track the research projects, annual plan, and financials for these research projects to report back to Congress. To provide an easier and more standardized way to submit all of those reports, USDA NIFA contracted with Booz Allen Hamilton to develop and continually improve on a custom reporting system. More information can be found on their website.
I started on this project after the team was a few years in already. I worked on this contract from Sept 2021 until its completion in April 2024.
Throughout my tenure with this project, I designed the following experiences:
Critical Issues Experience
View Project/Program Experience
Annual Report Experience

Financial Module (University Side)
Project/Program Close-out Experience
Associate Critical Issue Experience
View & Add Results Experience

Plan of Work Experience
OGFM Supplemental Report Experience
NRS Organizations Management Experience
Projects & Programs Experience
Results Experience
Financial Module (NIFA Side)
NRS User Management Experience
NRS Critical Issues Experience
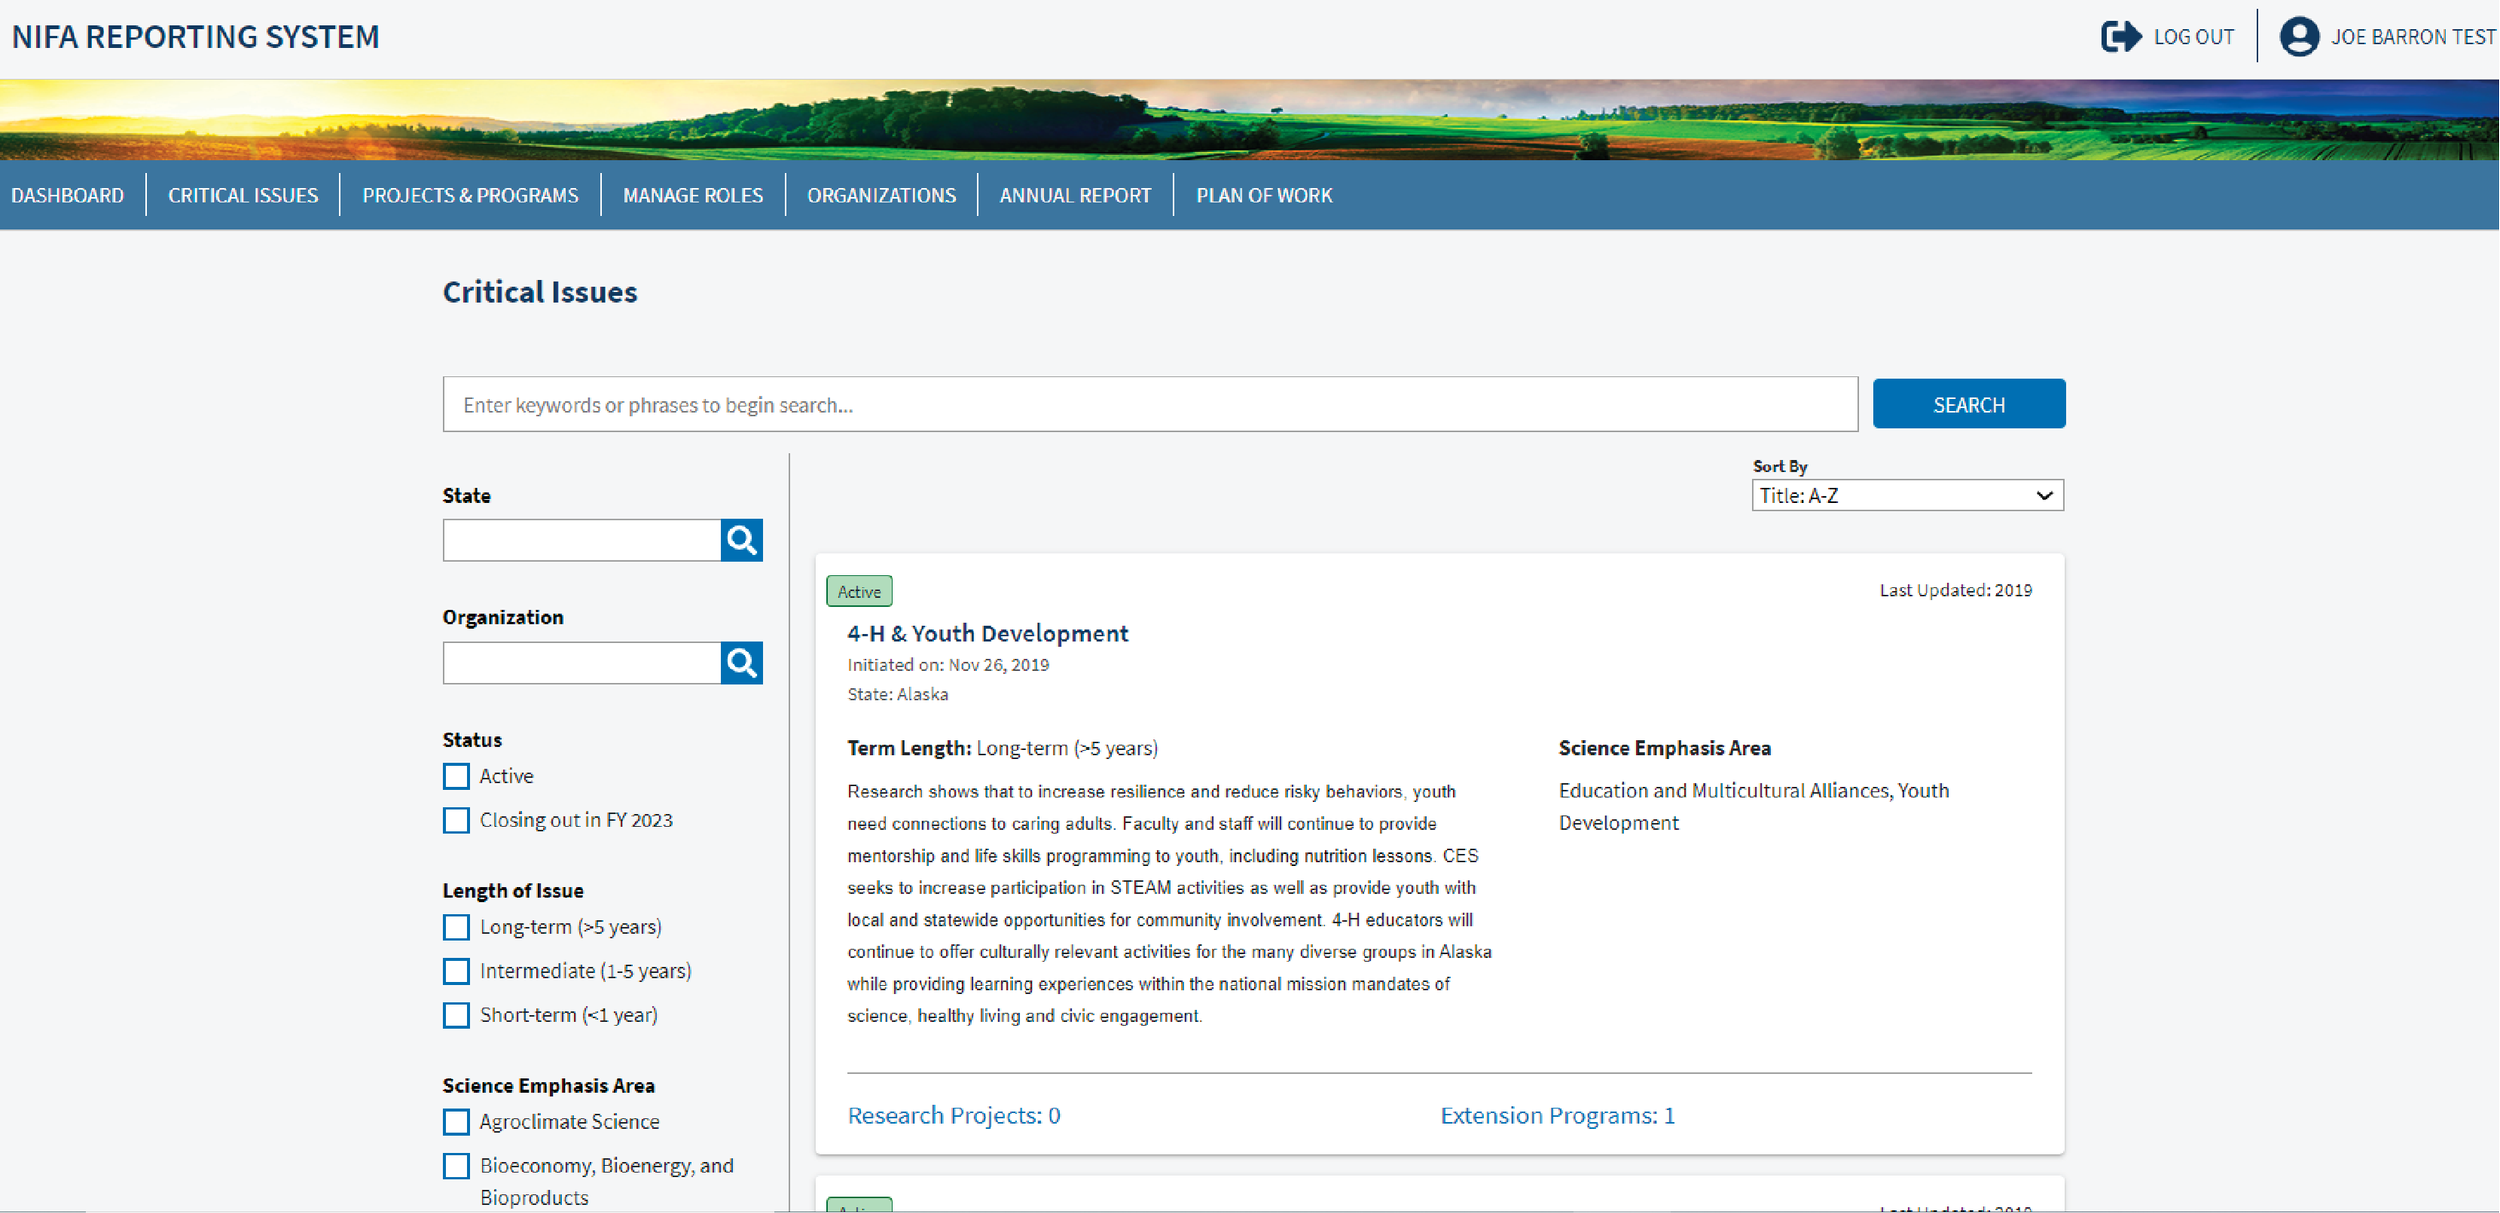
“Critical Issues” are a list of 5-10 goals that a Land Grant University focuses their research on. Each Research Project or Outreach Program that a University does has to align to one of the Critical Issues that the University lists out. These Critical Issues can be changed, added, or removed only once per year, at the beginning of the government fiscal year, when the University completes their “Plan of Work” document (see here.)
The users of NRS need to be able to see all of their Universities Critical Issues year round and see which projects/programs are associated to each Critical Issue.
Before, the Critical Issues on this page were shown in a large spreadsheet, 4 rows at a time (paginated) and required the user to go to another page to see the full information contained in the Critical Issue.
This newly designed experience improved the following:
Moved the filters into a side bar for easier usability
Moved the Critical Issues information to be on the same page, rather than opening up a new page
Added activity tags (e.g. “active” in the image above) to indicate to users which of the Critical Issues the University is currently using versus Archived Critical Issues.
Added a “Last Updated” tag to inform the user how recent and relevant a given Critical Issue is
Added a count of Research Projects and Extension Programs to the bottom of each Critical Issue to inform the user which Projects/Programs are officially tied to each Critical Issue.
Clicking on the text opens a modal which shows overview details for all the associated projects/programs
Associate Critical Issue Experience
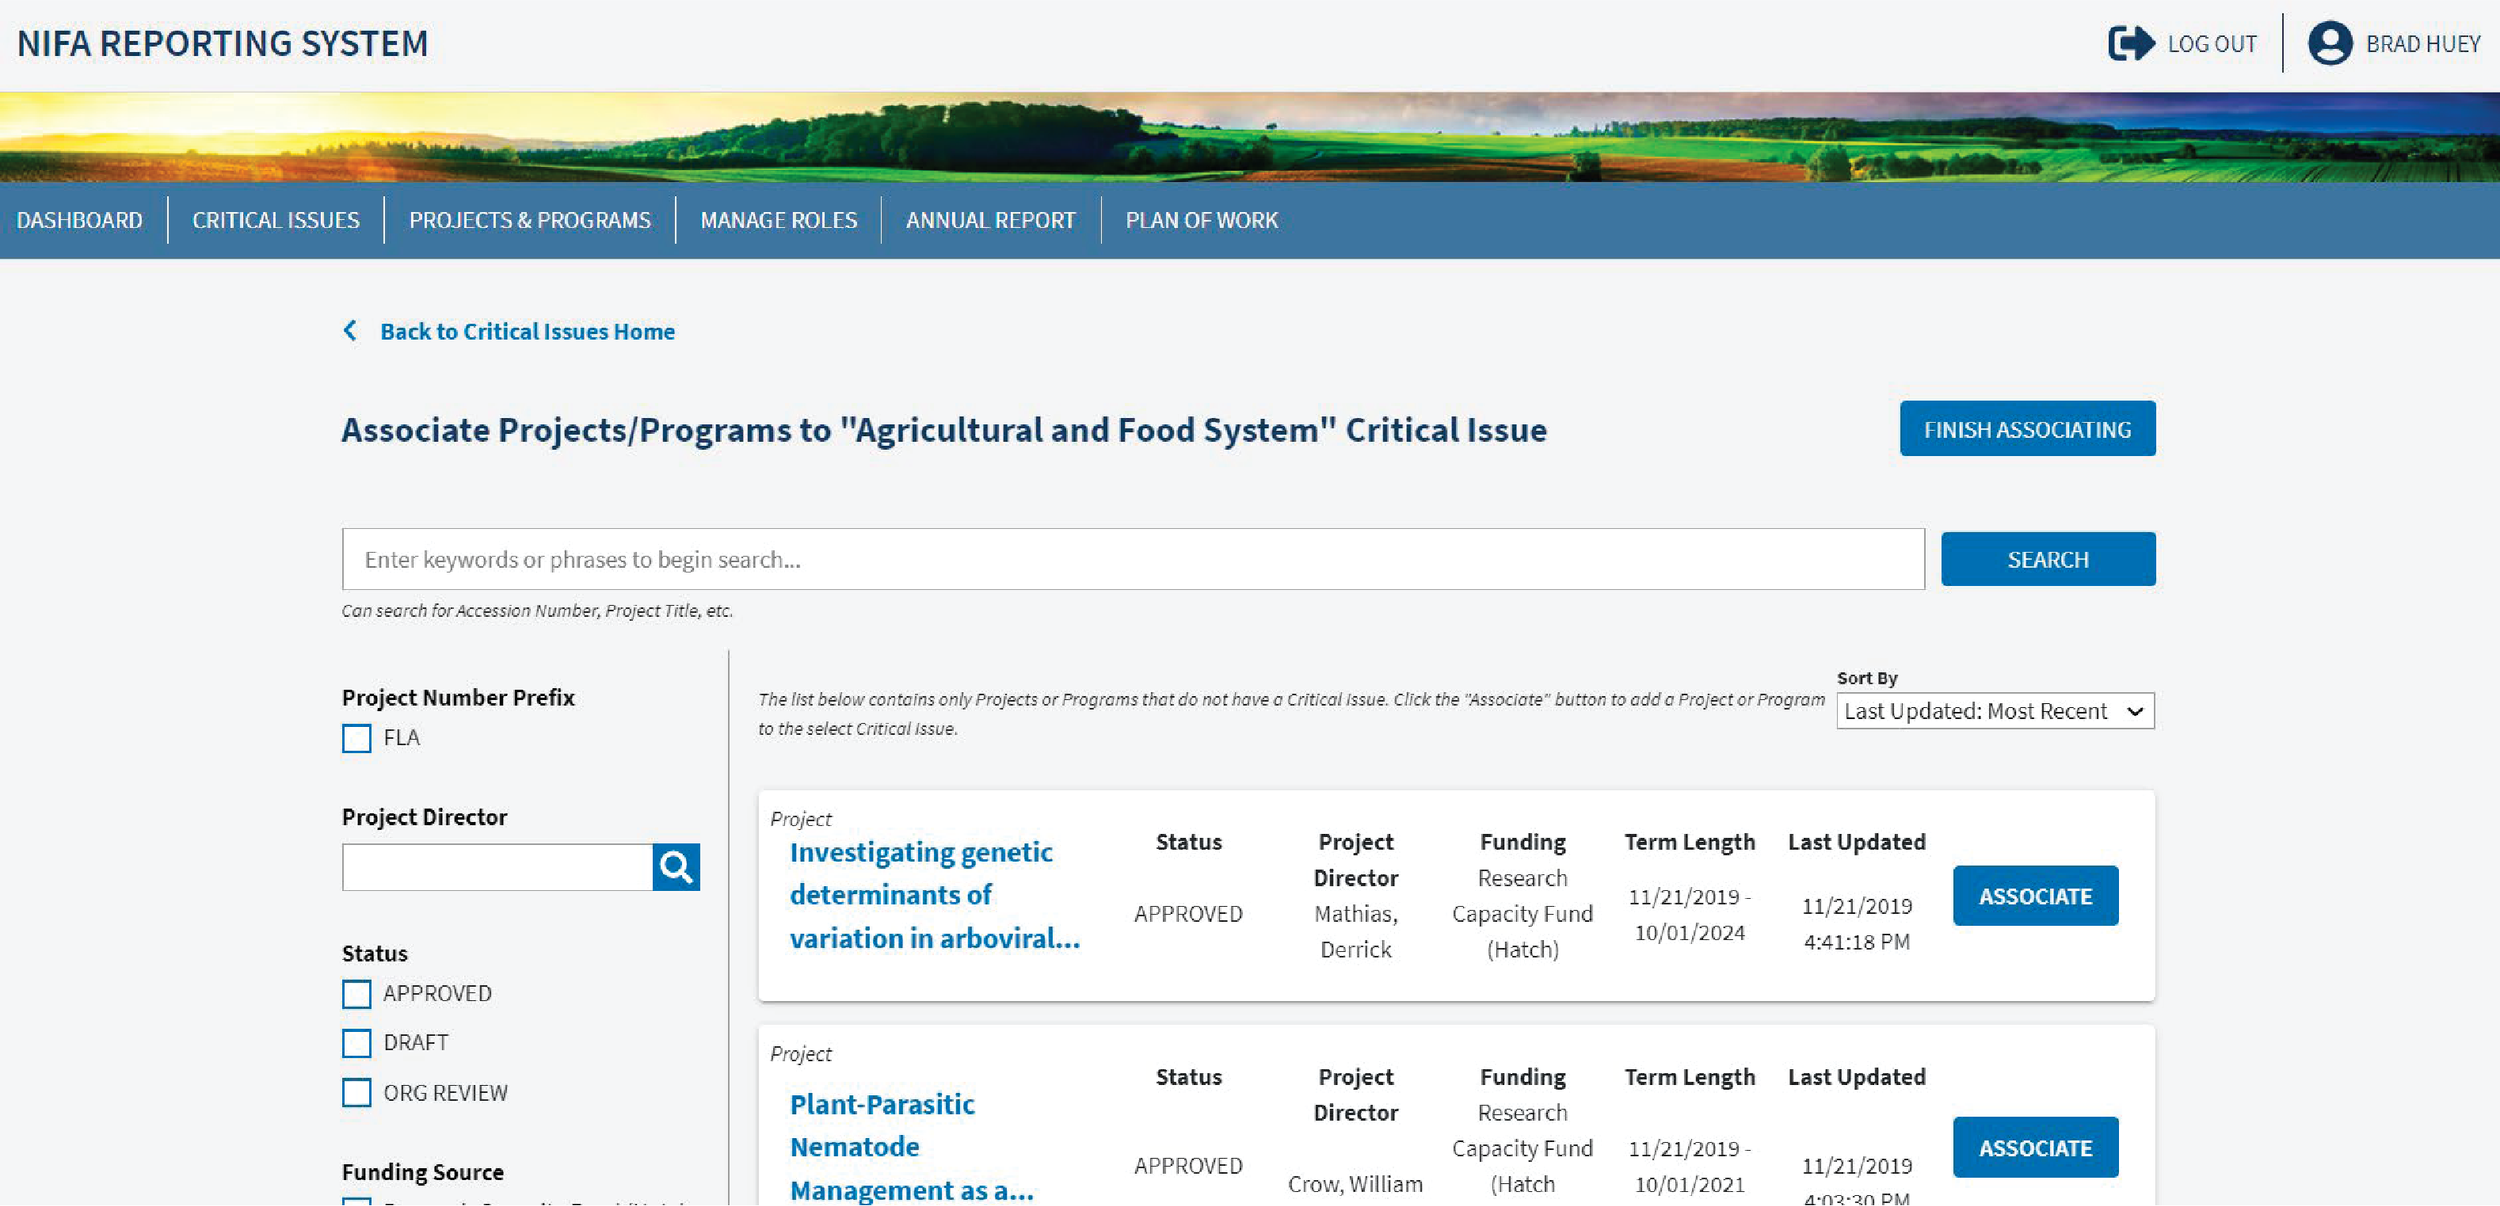
Typically, Projects or Programs are assigned to a Critical Issue when they’re created. There are some potential experiences where a project/program could become ‘orphaned’ — become disconnected from the Critical Issue it was previously assigned to. For example, if a University decided to delete one of their Critical Issues, all of the projects/programs that were associated with the now deleted Critical Issue are still in the system, but now no longer have any connection to that University’s current work. The concept of an “Associate Project/Program” experience was a brand new one to the NIFA Reporting System.
This experience created the following features for users:
Ability to easily re-associate ‘orphaned’ projects/programs to an active Critical Issue
Ability to see which projects/programs at a University were without a Critical Issue
Ability to search and filter the list of ‘orphaned’ projects/programs
NRS Projects and Programs Experience
Research Projects and Extension Programs are the two main types of work that a Land Grant University works on. Research Programs are scientific studies within a particular area of interest for a University. An Extension Program is how the Universities share the knowledge gained from the Research Projects to the general public - typically with different types of outreach.
When I first started on this contract, this page was a spreadsheet of information with only 4 lines of content before the user needed to load a new page.
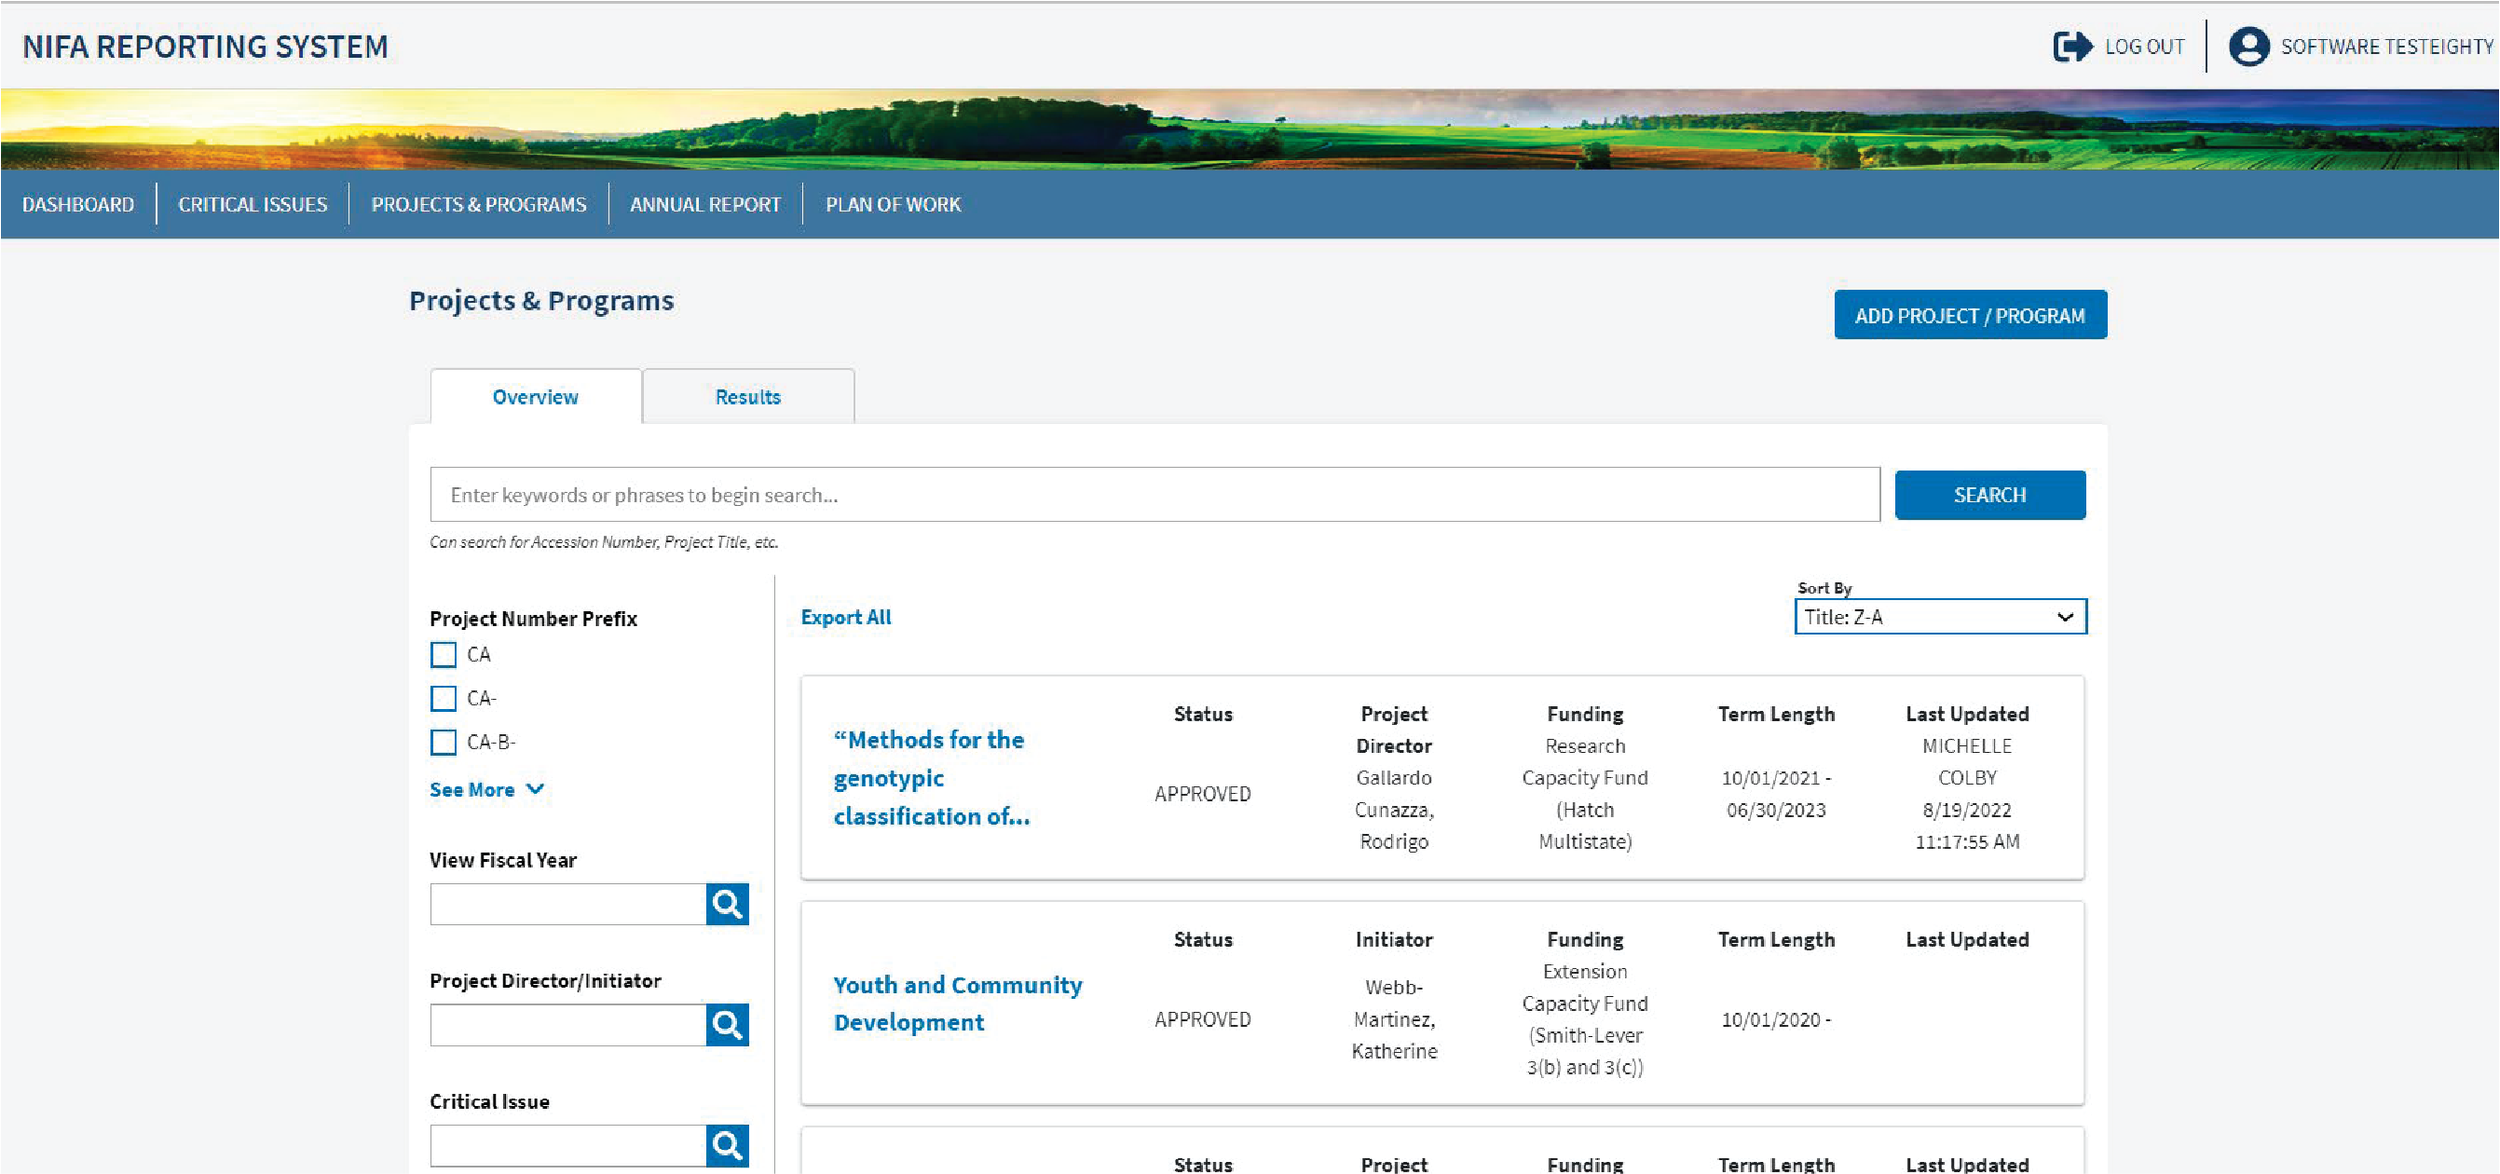
This page, the Projects & Programs main page, is the page that Universities use most often. University admins and researchers need to be able to see all active Projects and Programs that their university is working on at any given time, as well as any past or completed projects or programs.
With this knowledge, I re-imagined the page such that it was easier for users to find the information they needed and easier to read overall.
This newly designed experience improved the following:
Moved filters into a side bar for easier use
Reorganized & condensed the Project/Program information to the info that a user would most need when looking at an overview of a list of projects & programs.
Created a tabbed list to be able to more easily see both Projects/Programs and Results
see here for an explanation of this experience
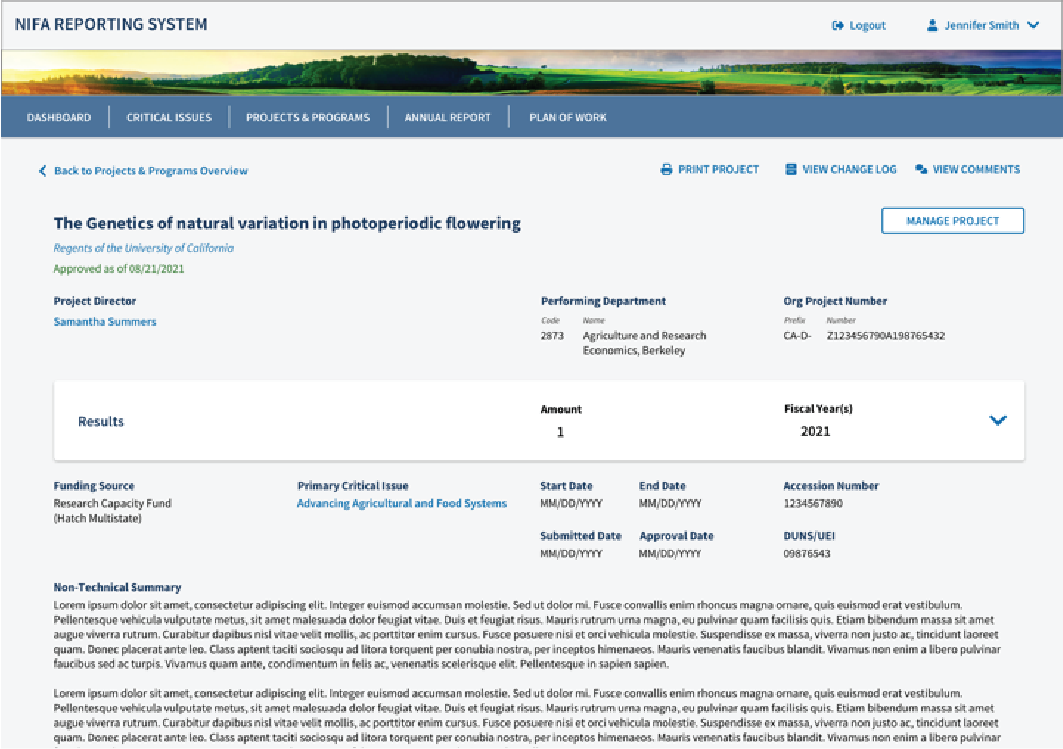
View Project/Program Page
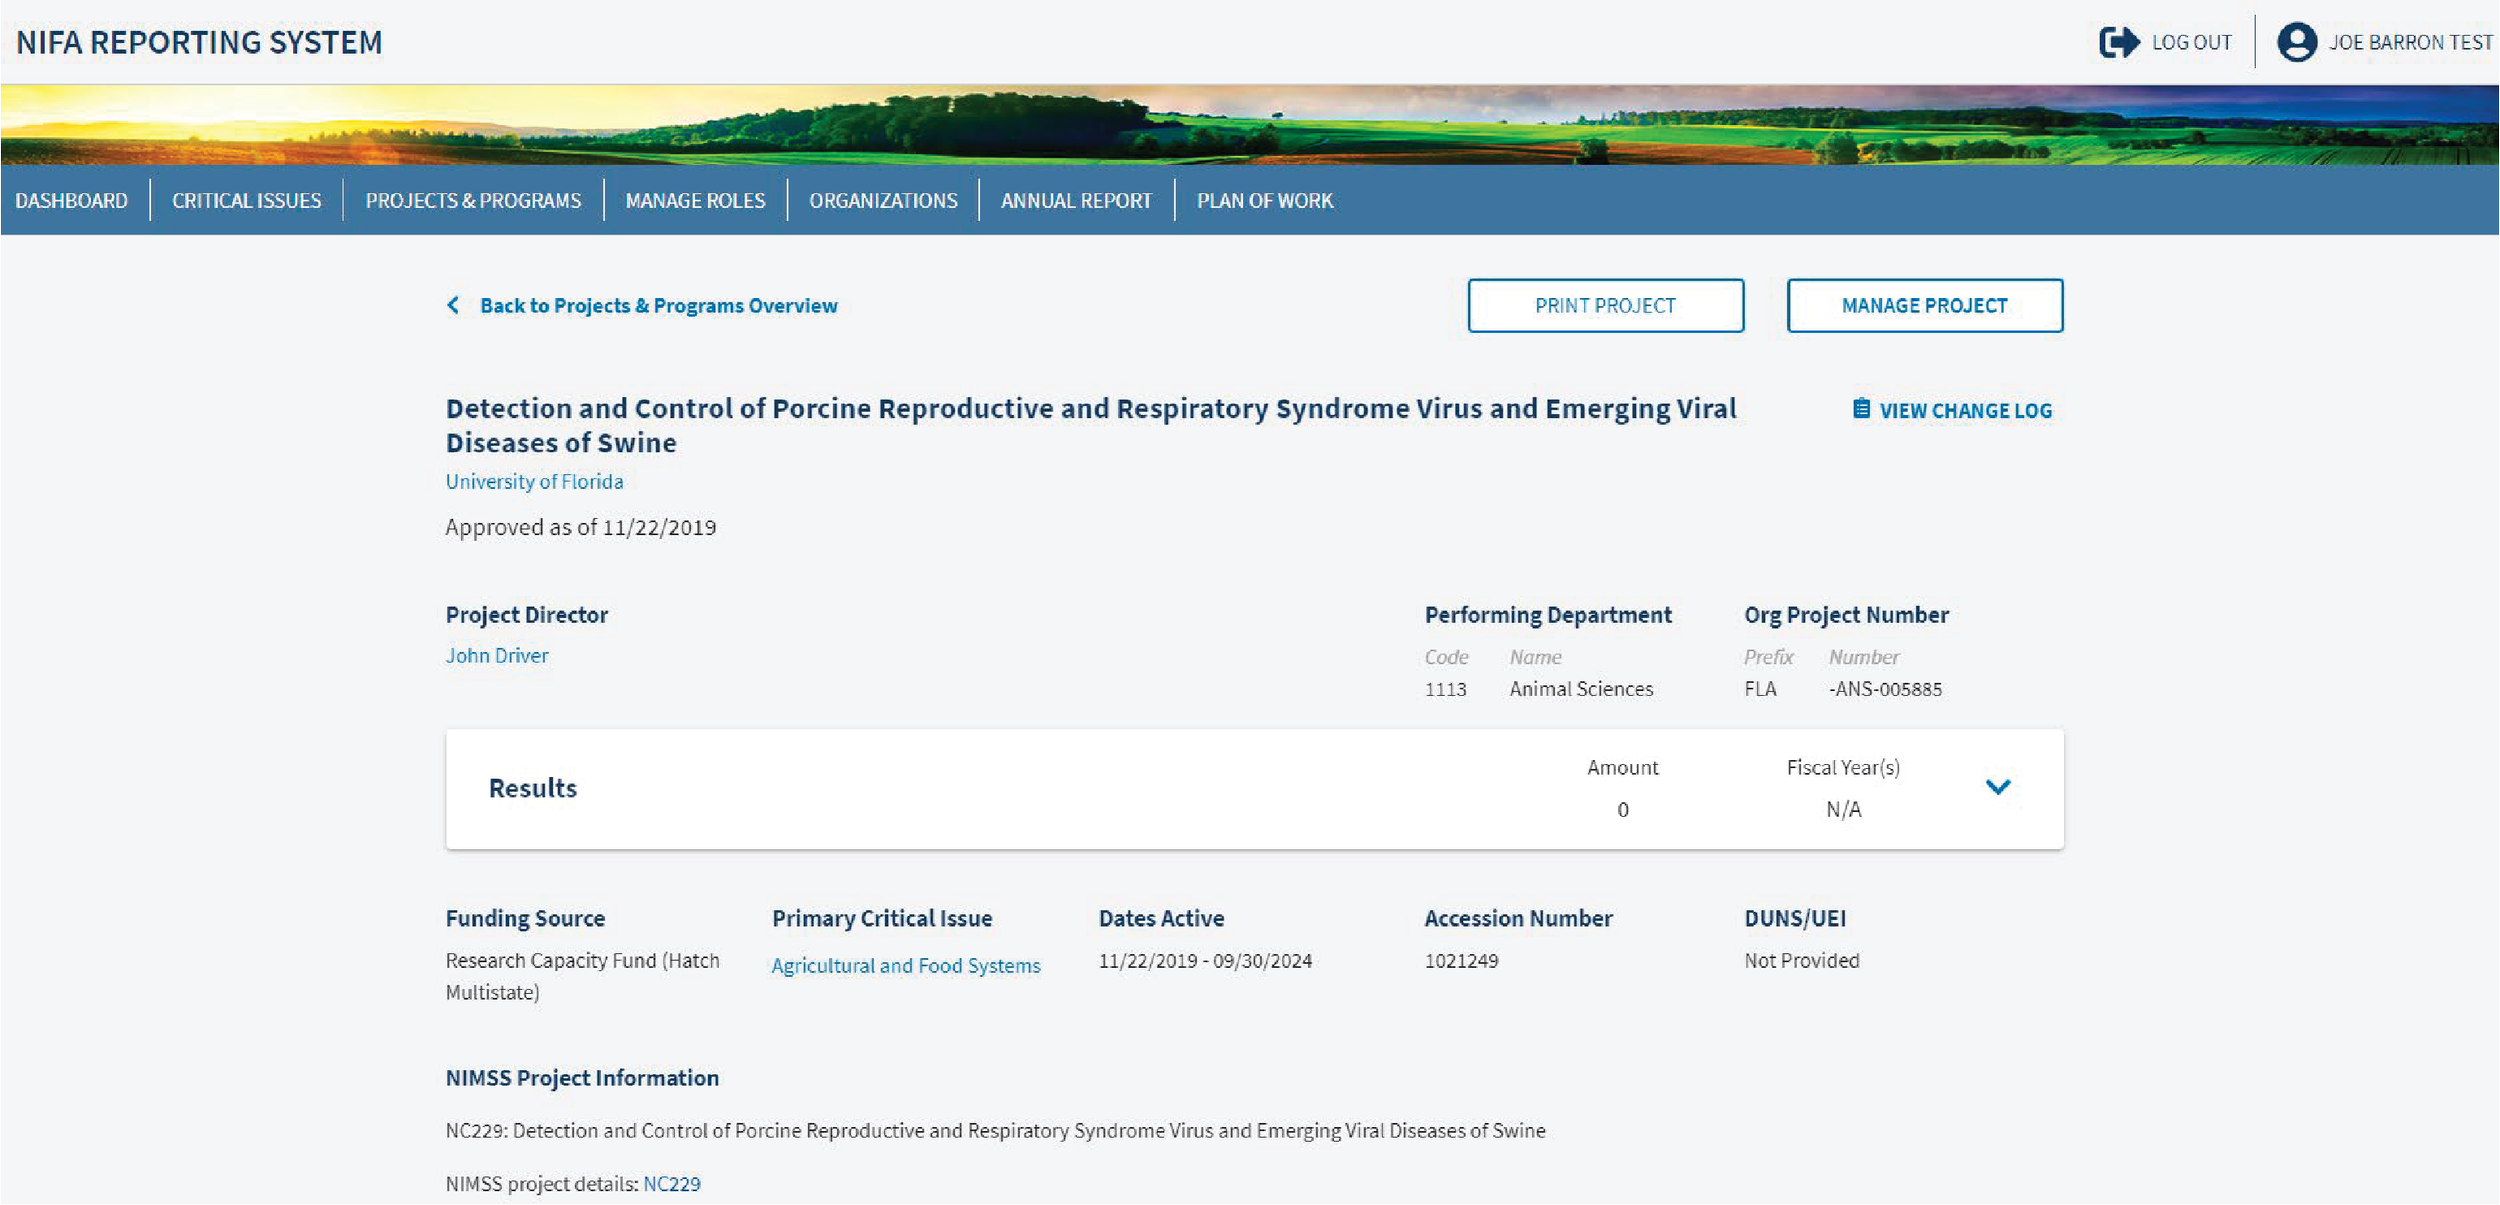
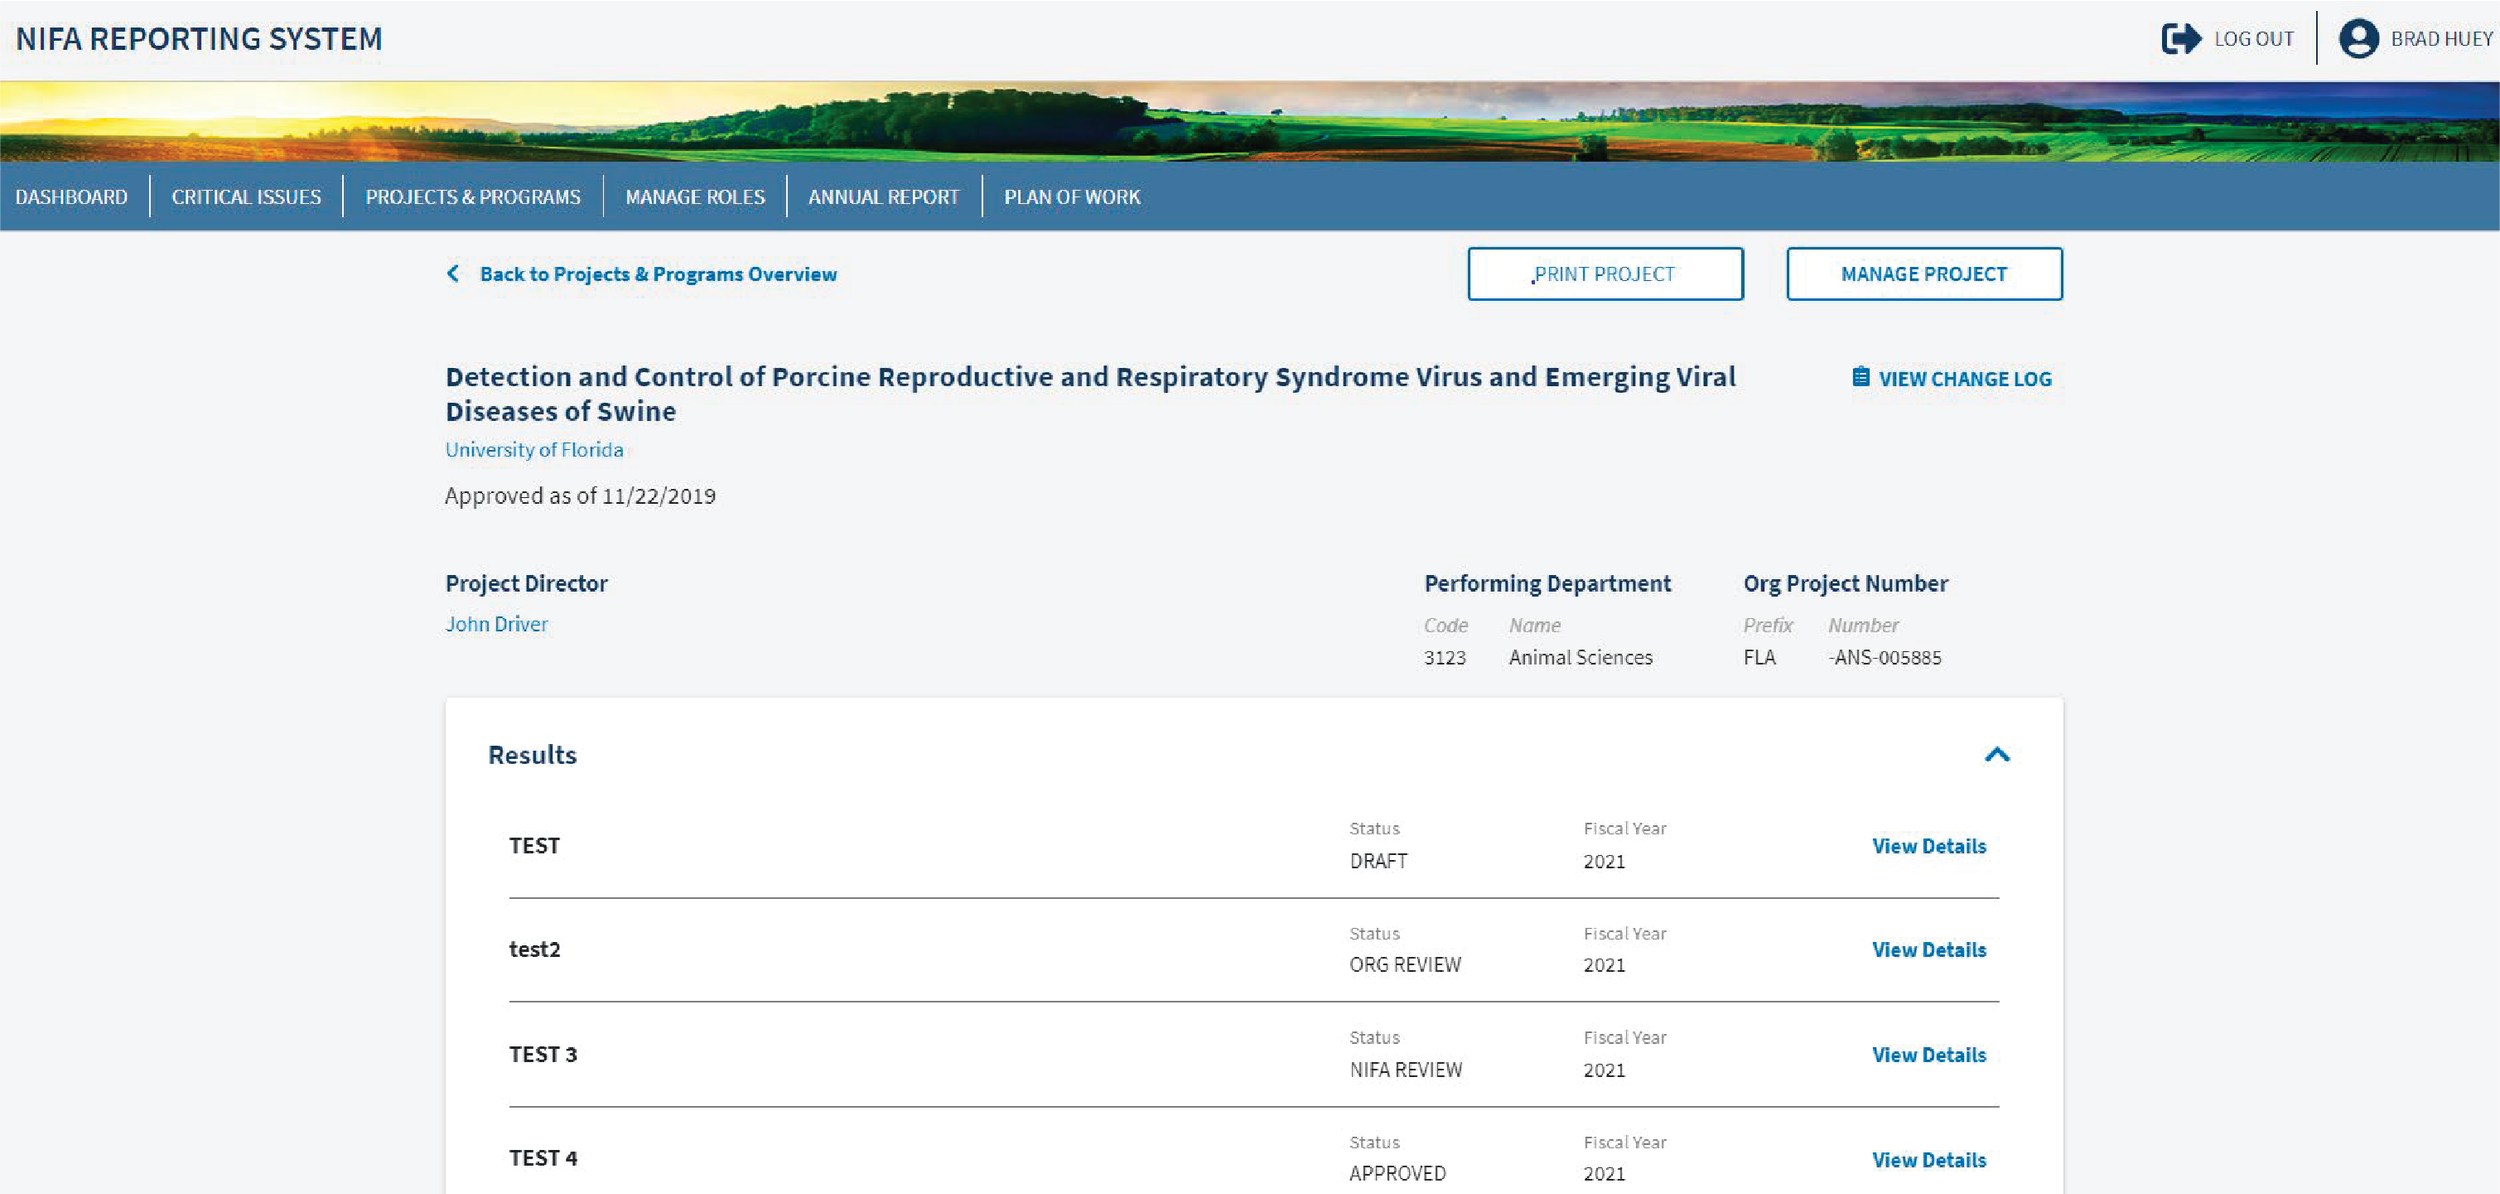
The Project/Program page shows all of the details of a given project or program. When I started on this contract, this page was all left aligned, single spaced down the page. Users complained about not being able to find information easily on the old page design.
One of my first tasks on this contract was to optimize this page and help organize information to support additional features that we would add in the future.
This newly designed experience improved the following:
Organized information into groups on the page to better visually associate related pieces of information together
Added a section to be able to view the Results of a project or program
See Results Experience
Added a more visible Print and Manage button at the top of the page
Created a “manage” button to hide less used features
Clicking on that button opens a small modal which contains the “Edit” feature and the “Archive” feature.
View and Add Results Experience
Results are yearly report updates for a project or a program. Land Grant Universities are required to make a yearly results report for all of their active projects and programs to give an update on the status of the project/program or to report on the final outcomes of a project/program.
Users needed a way to be able to see all results for a given project/program on the View Project/Program Page and to add new results.
Before, this experience was on its own separate page and the results did not visually relate to the projects/programs they were associated with at all.
This experience created the following new features for users:
Allowed users to see the amount of results associated with a particular project or program
Allowed users to see individual results for a project or a program
When users click on the title of a result, a modal opens that shows the full result details
Users can easily see the status of all of the results associated with a particular project or program
At the bottom of the drop down container, there is an “Add Results” button that users can easily add a result to a particular project or program
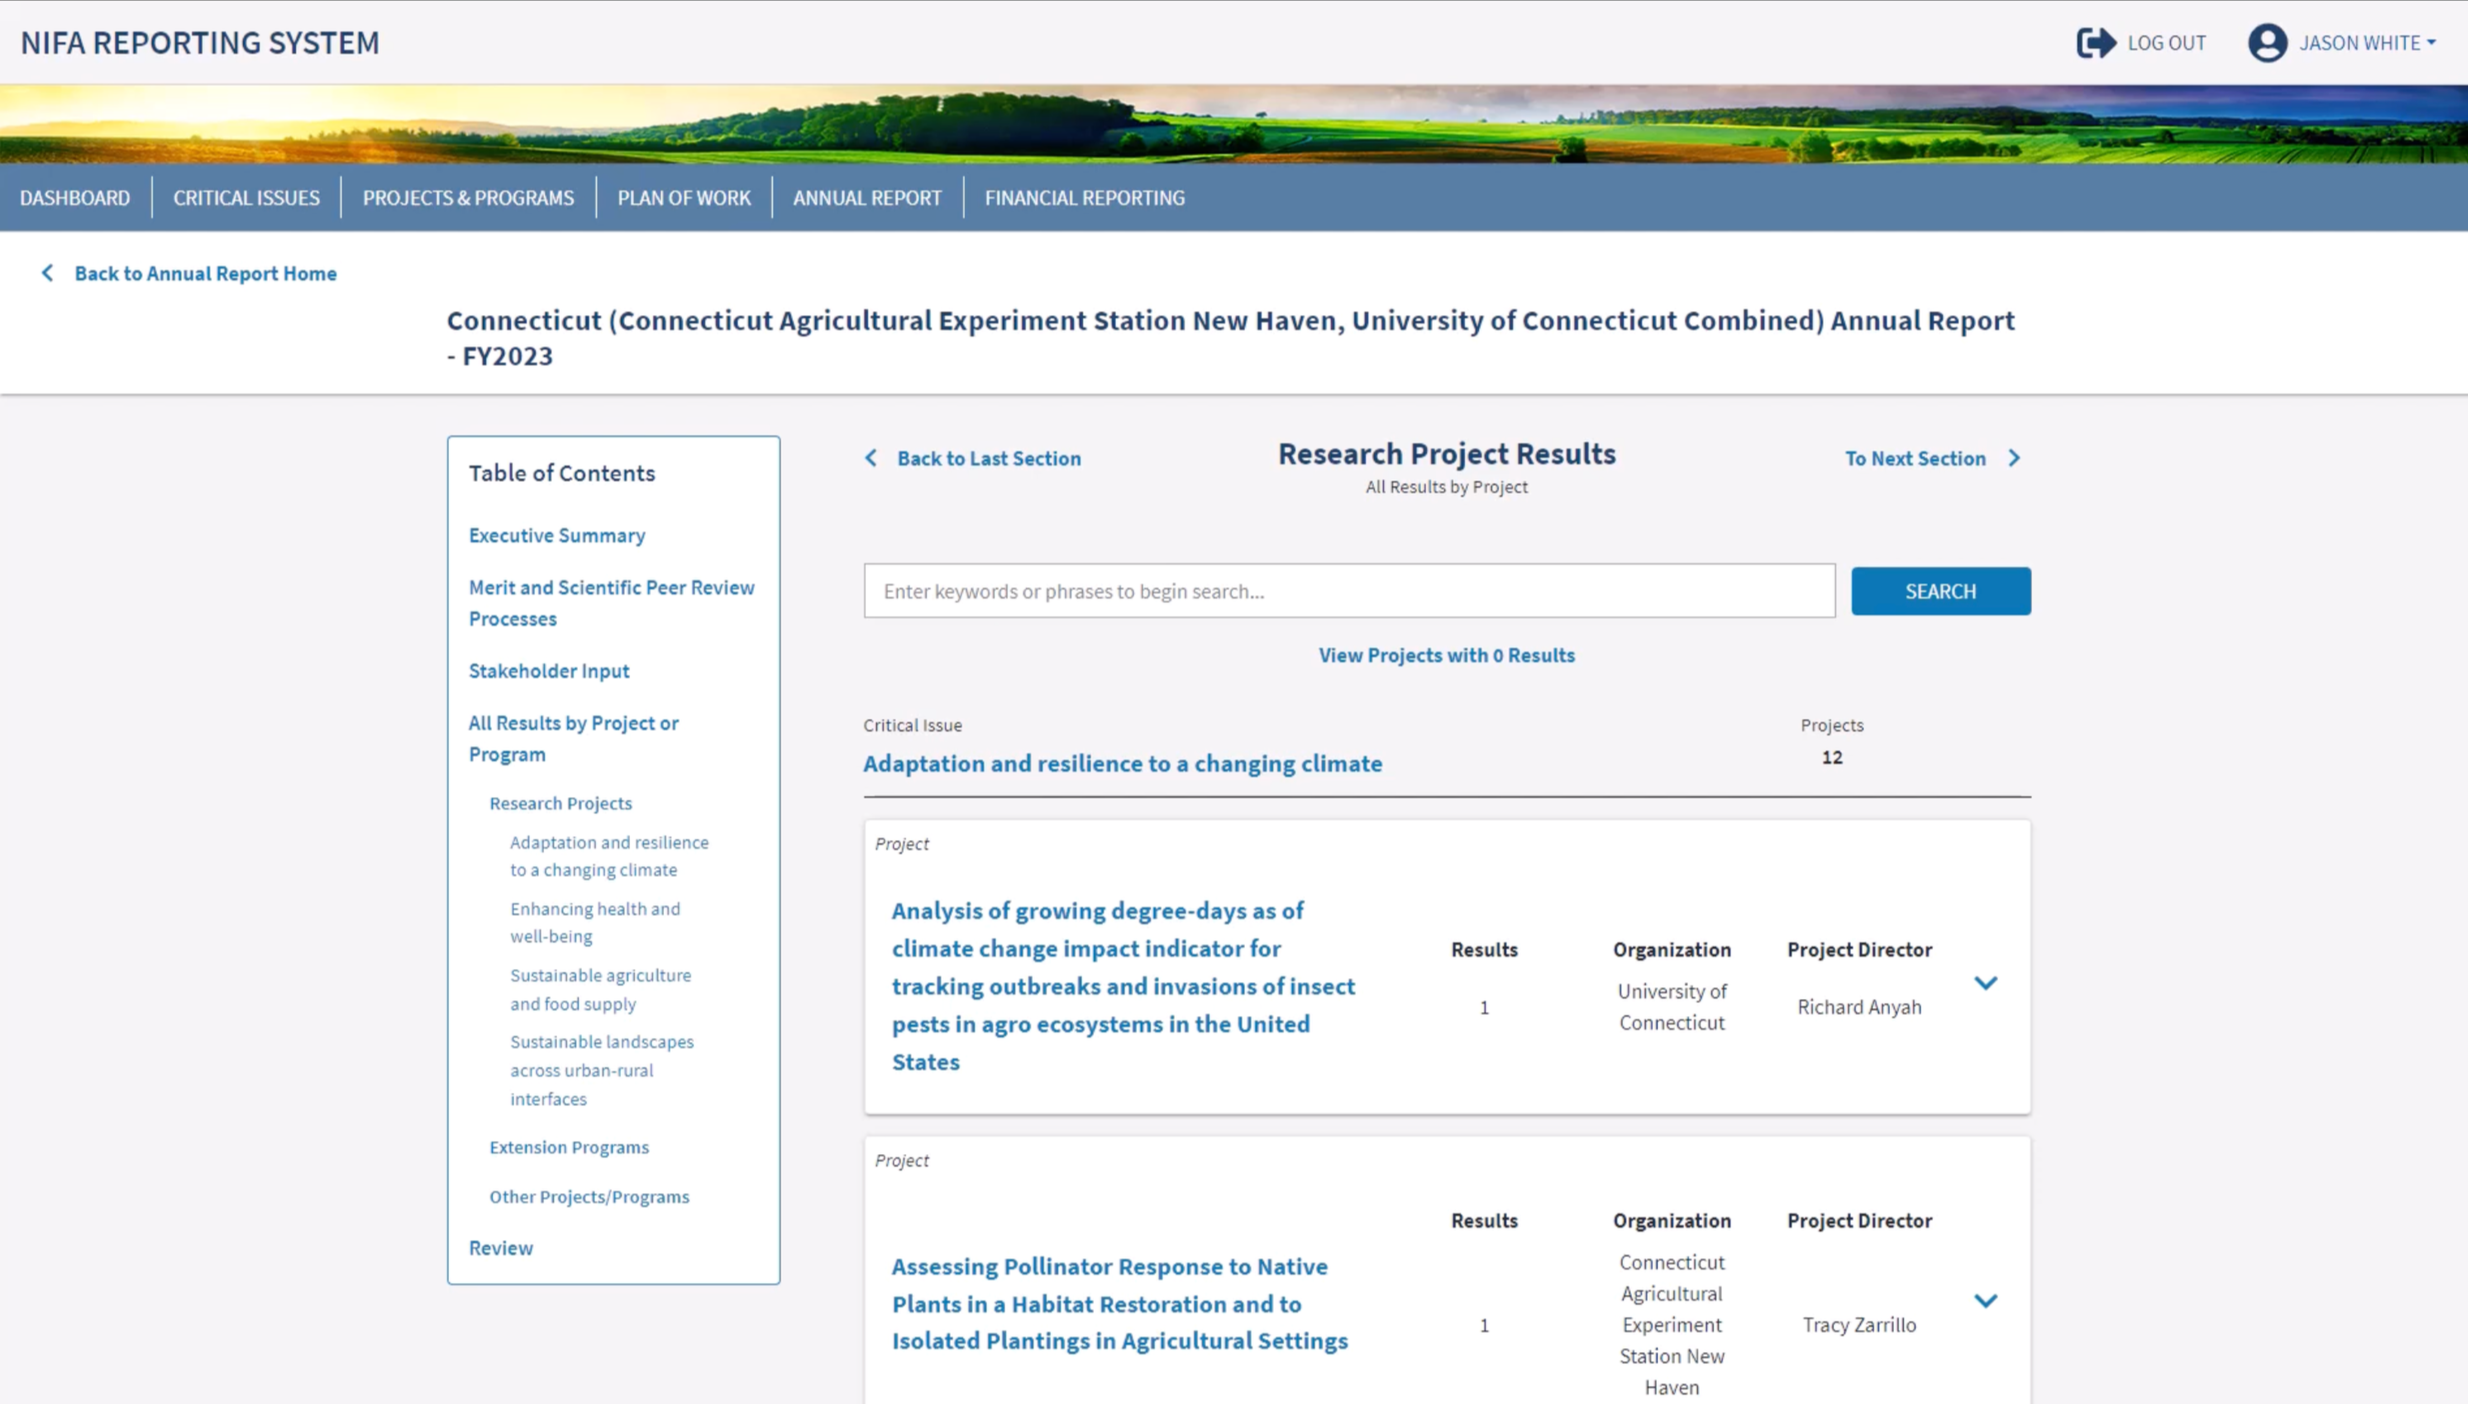
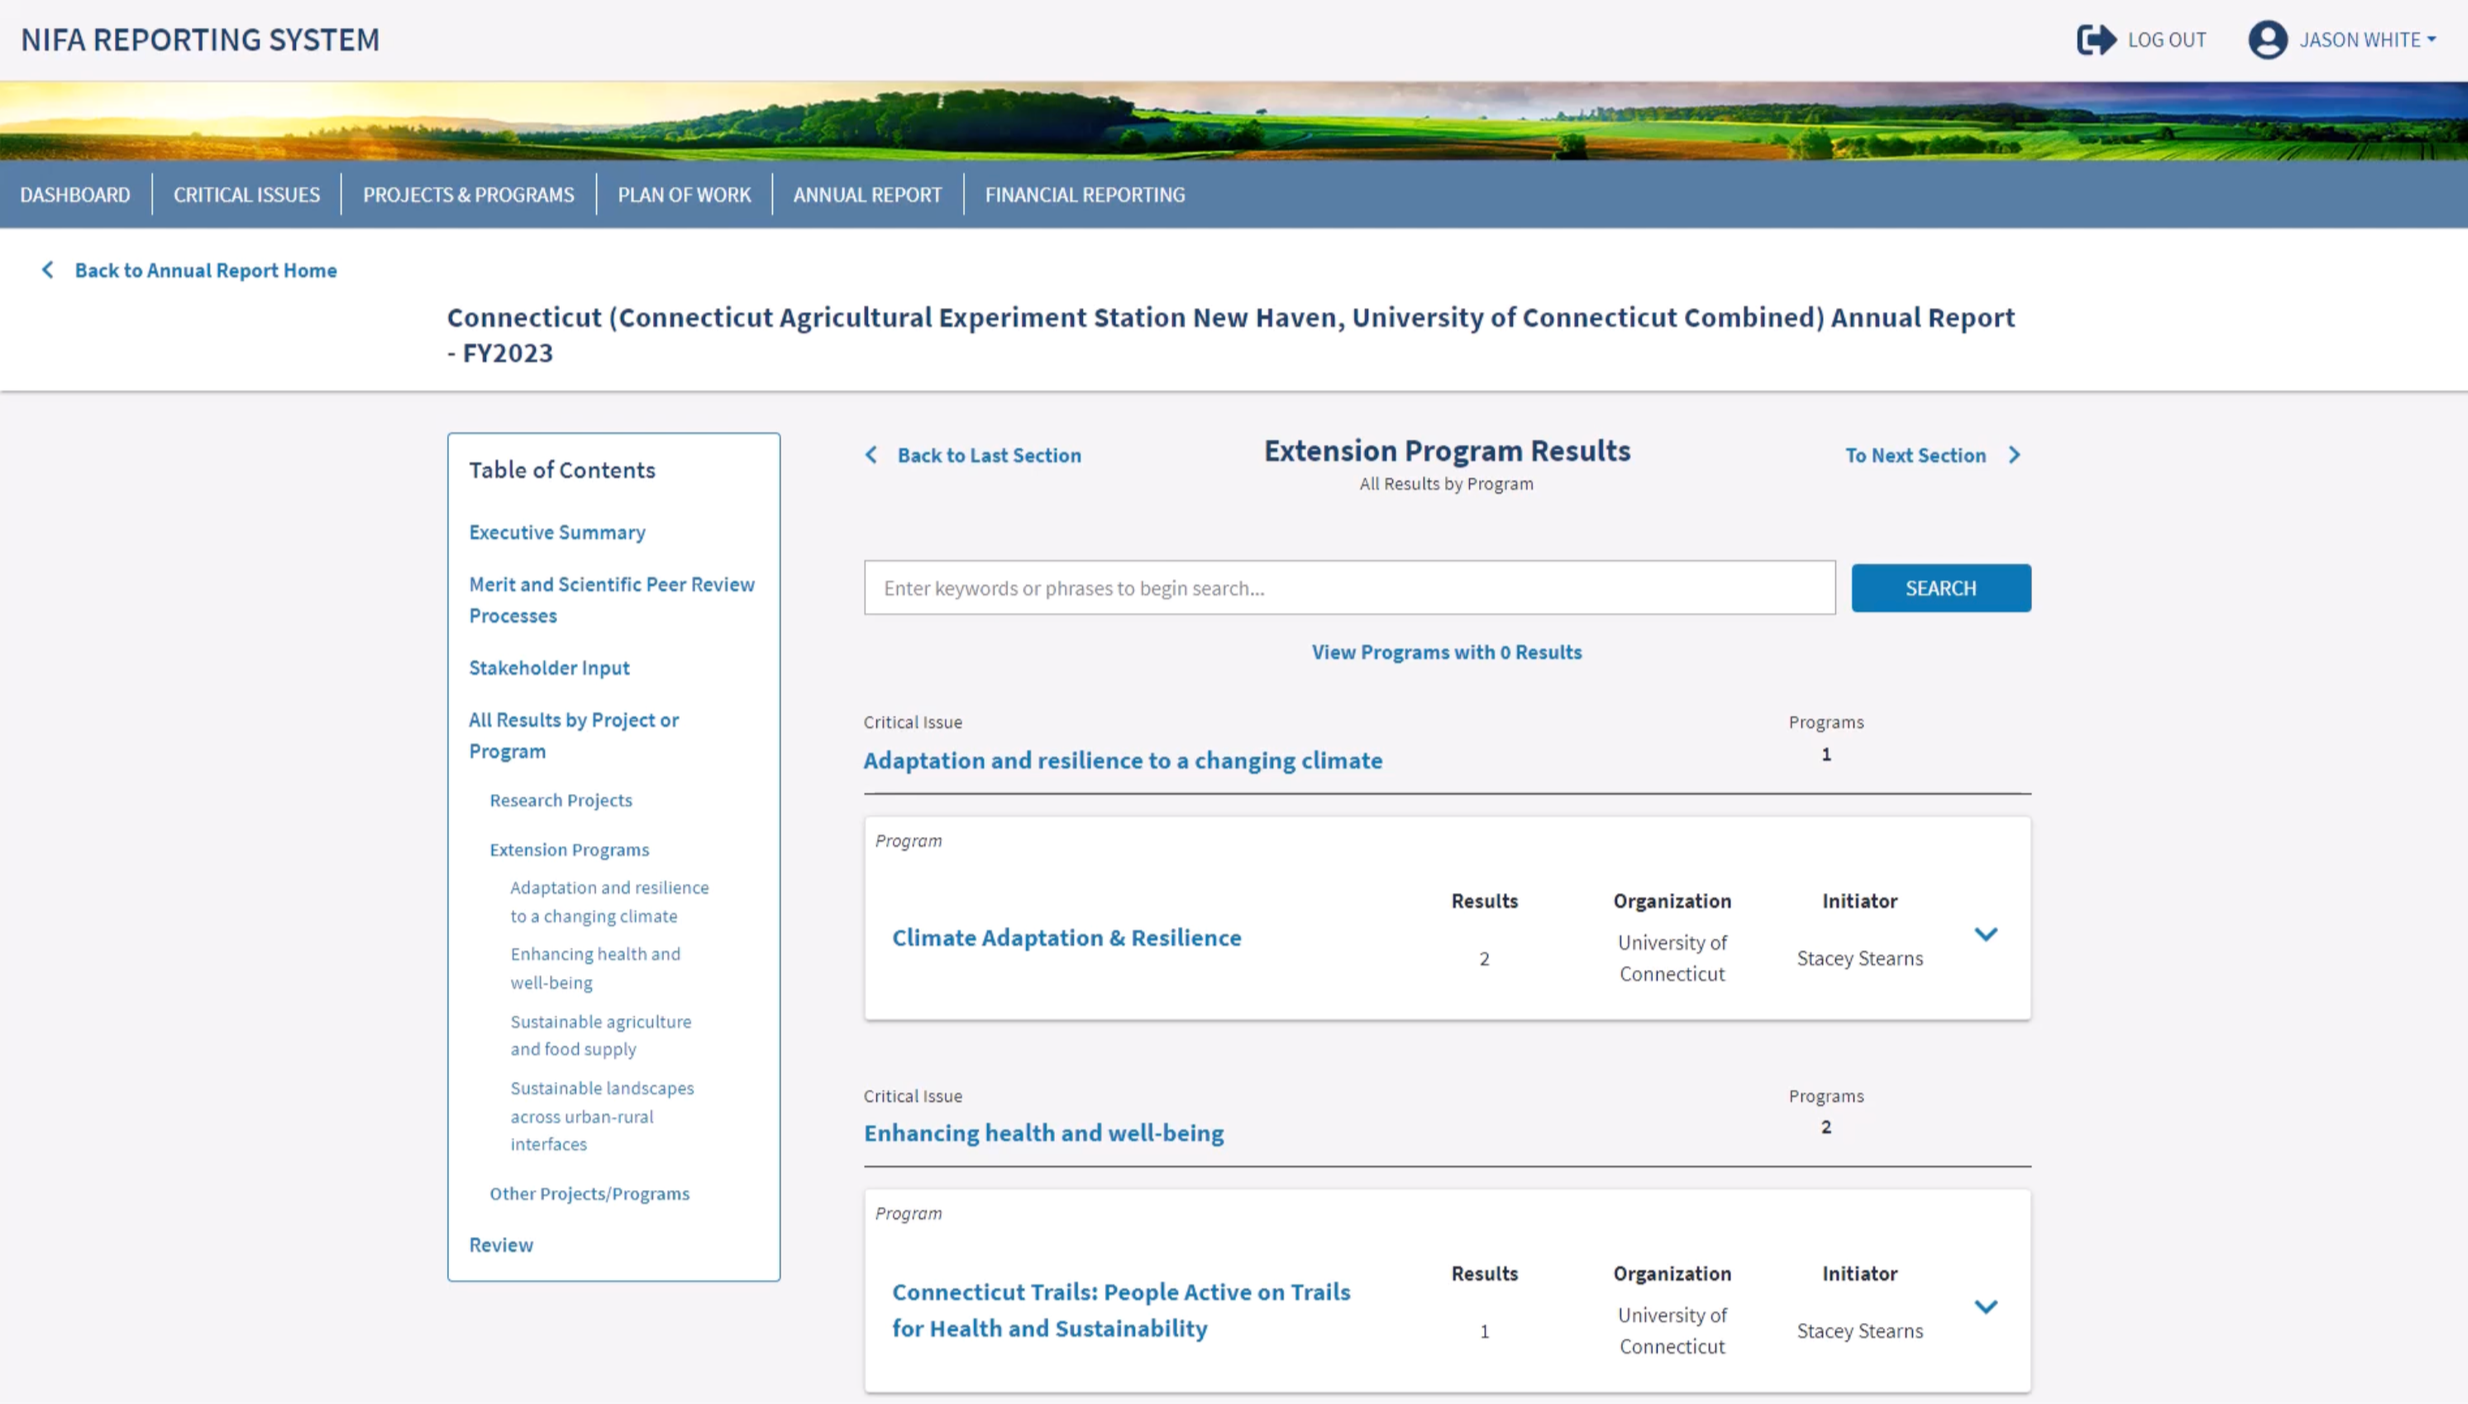
Results Overview Experience
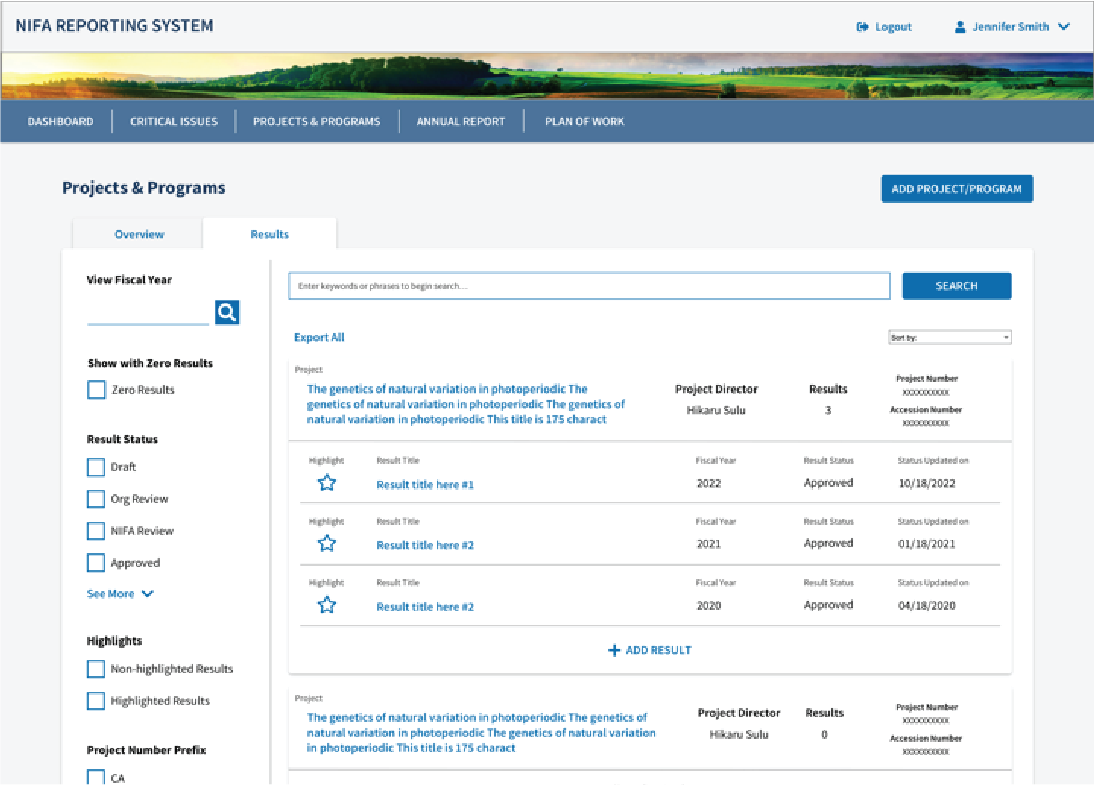
In addition to being able to see a list of Results for a specific project or program, users needed to be able to search a list of all Results. From talking to users, it became clear that they needed to be able to see the list of all Results, but having the project/program they were associated with was still incredibly important as many of the Result Titles didn’t reference the project/program at all.
A page similar to this existed when I joined this contract, but it was a separate page, not related to Projects/Programs at all. It only showed an alphabetical list of all Results. To make sure that the Results stayed related to the Projects/Programs, I opted to make the Results a tab within the Project/Program Overview page.
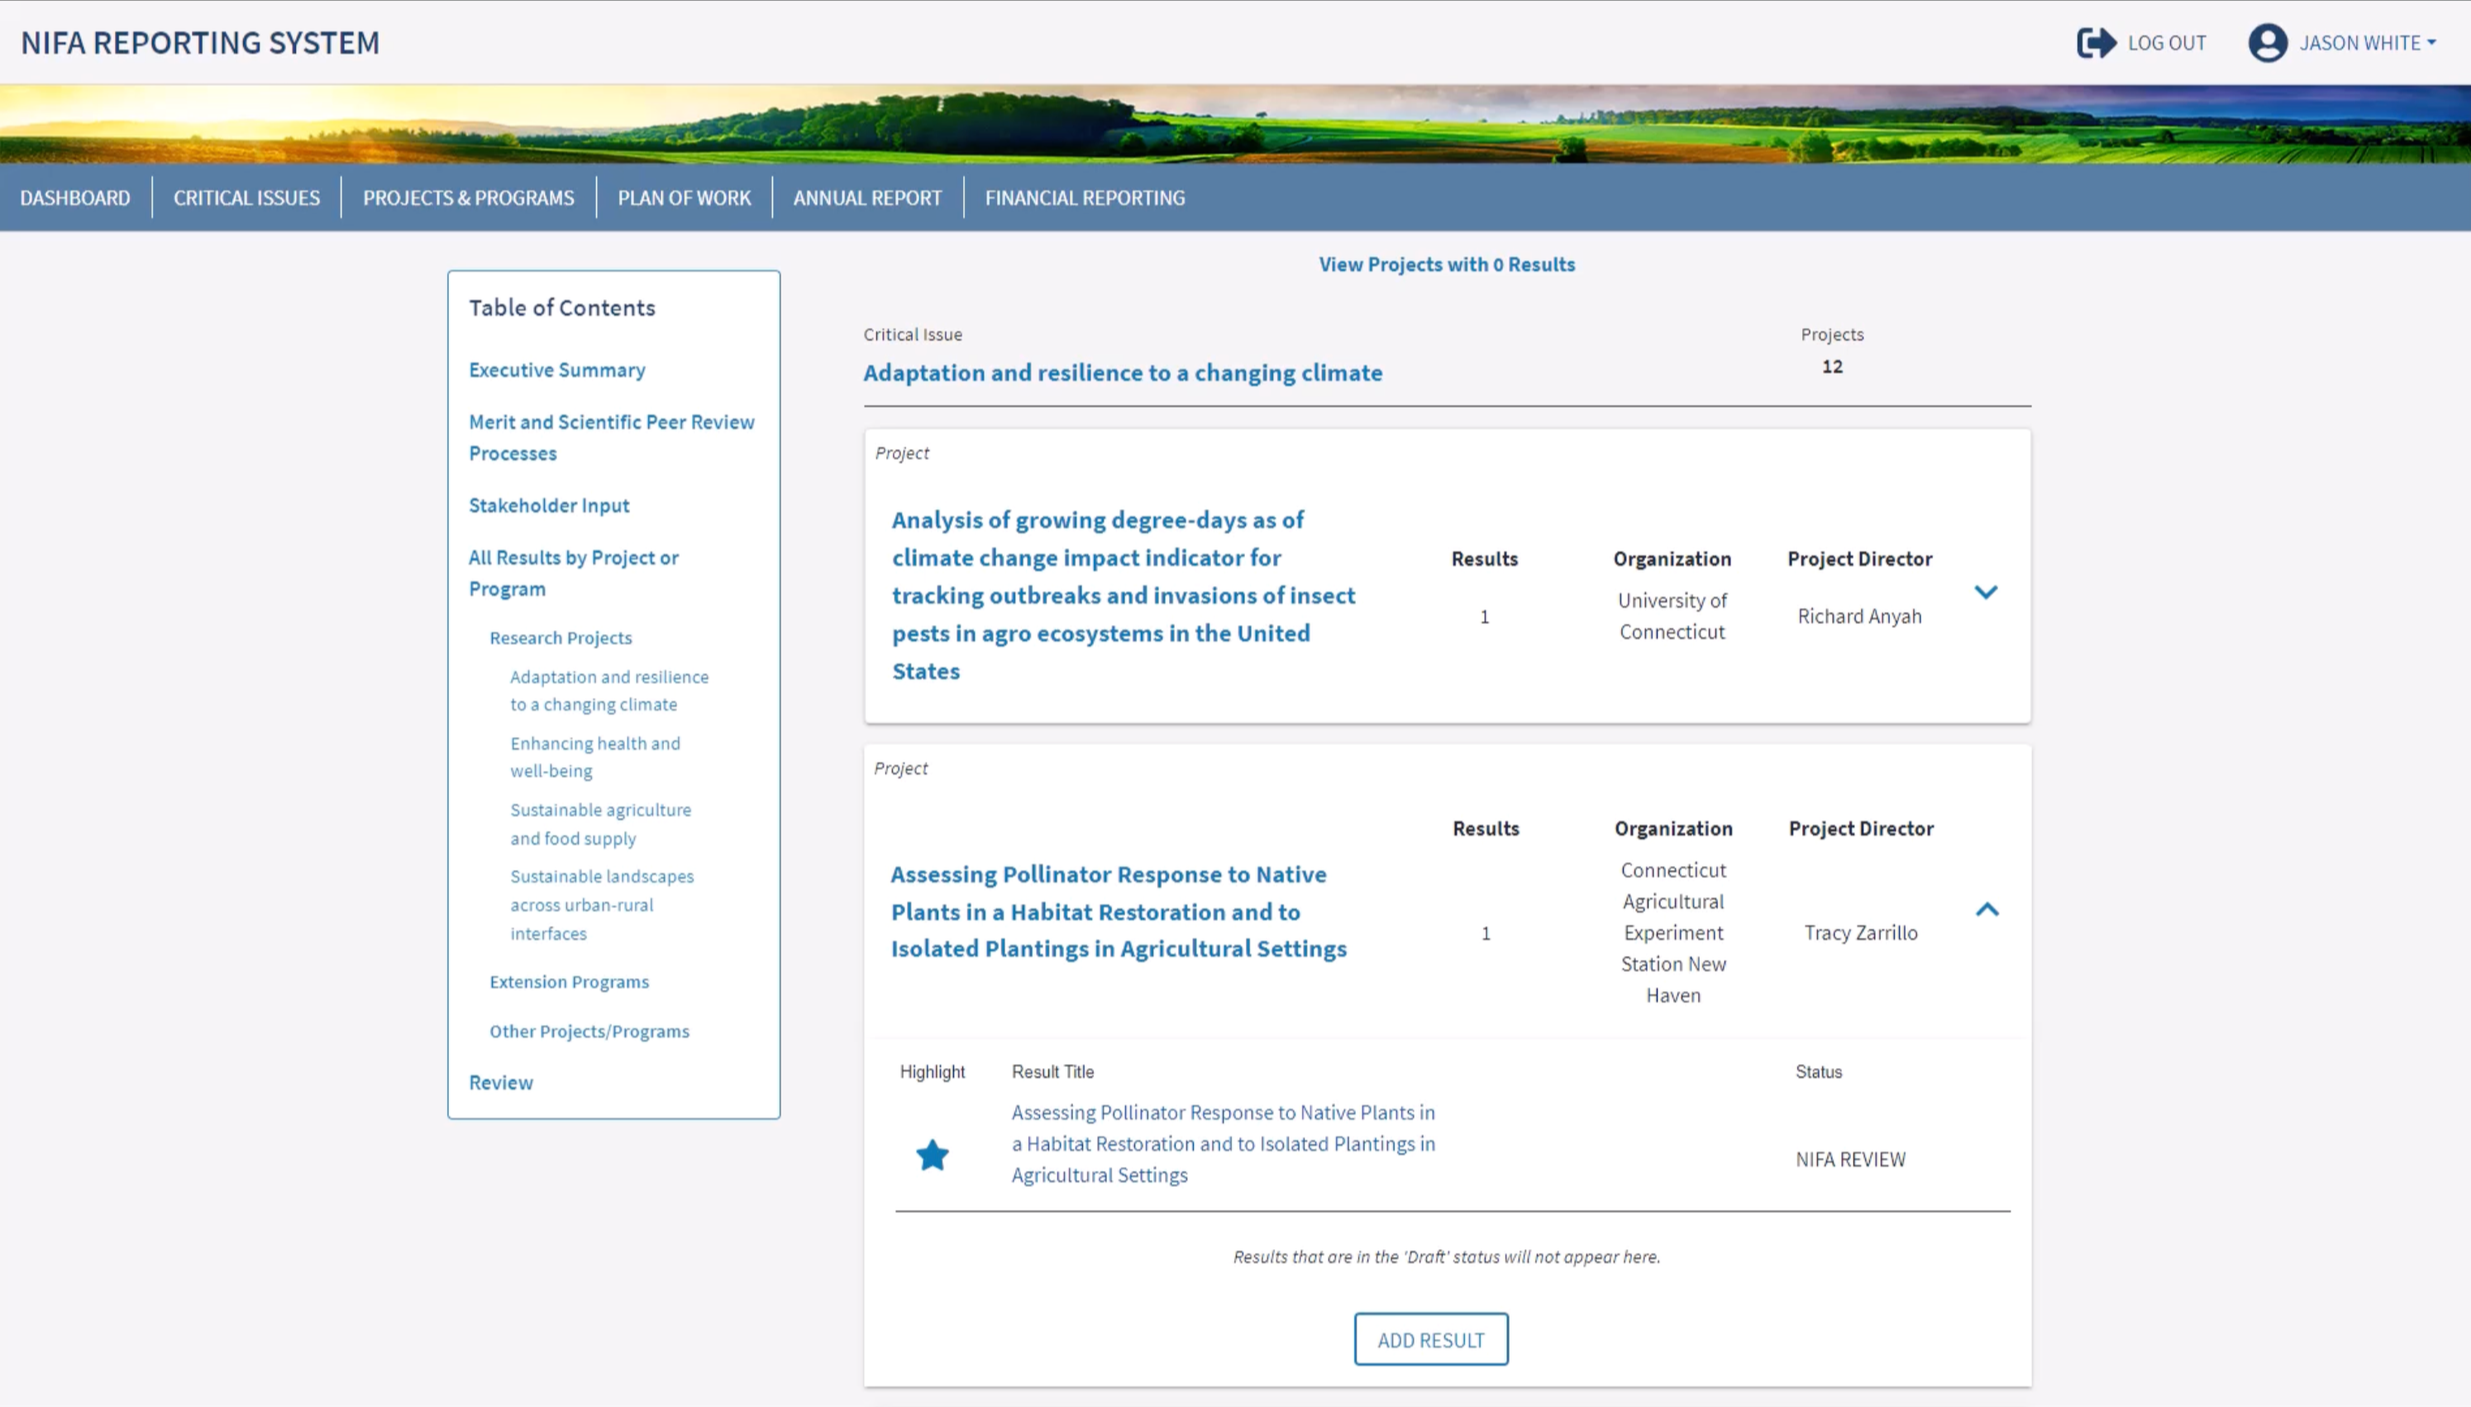
Additionally, we added the ability to ‘Highlight’ (Star) individual results on this page. Users needed an easy way to be able denote a result that they wanted to add and showcase within their yearly Annual Report. Please see the “Annual Report” section for more information on this experience.
This experience created the following new features for users:
Ability to see a list of all Results for all Projects/Programs at a University
Ability to see Result status for all results
Ability to see Result Fiscal year for all results
Ability to add a result directly from the Results Overview page
Ability to search all Results
Ability to filter all Results
Ability to highlight Results for the Annual Report
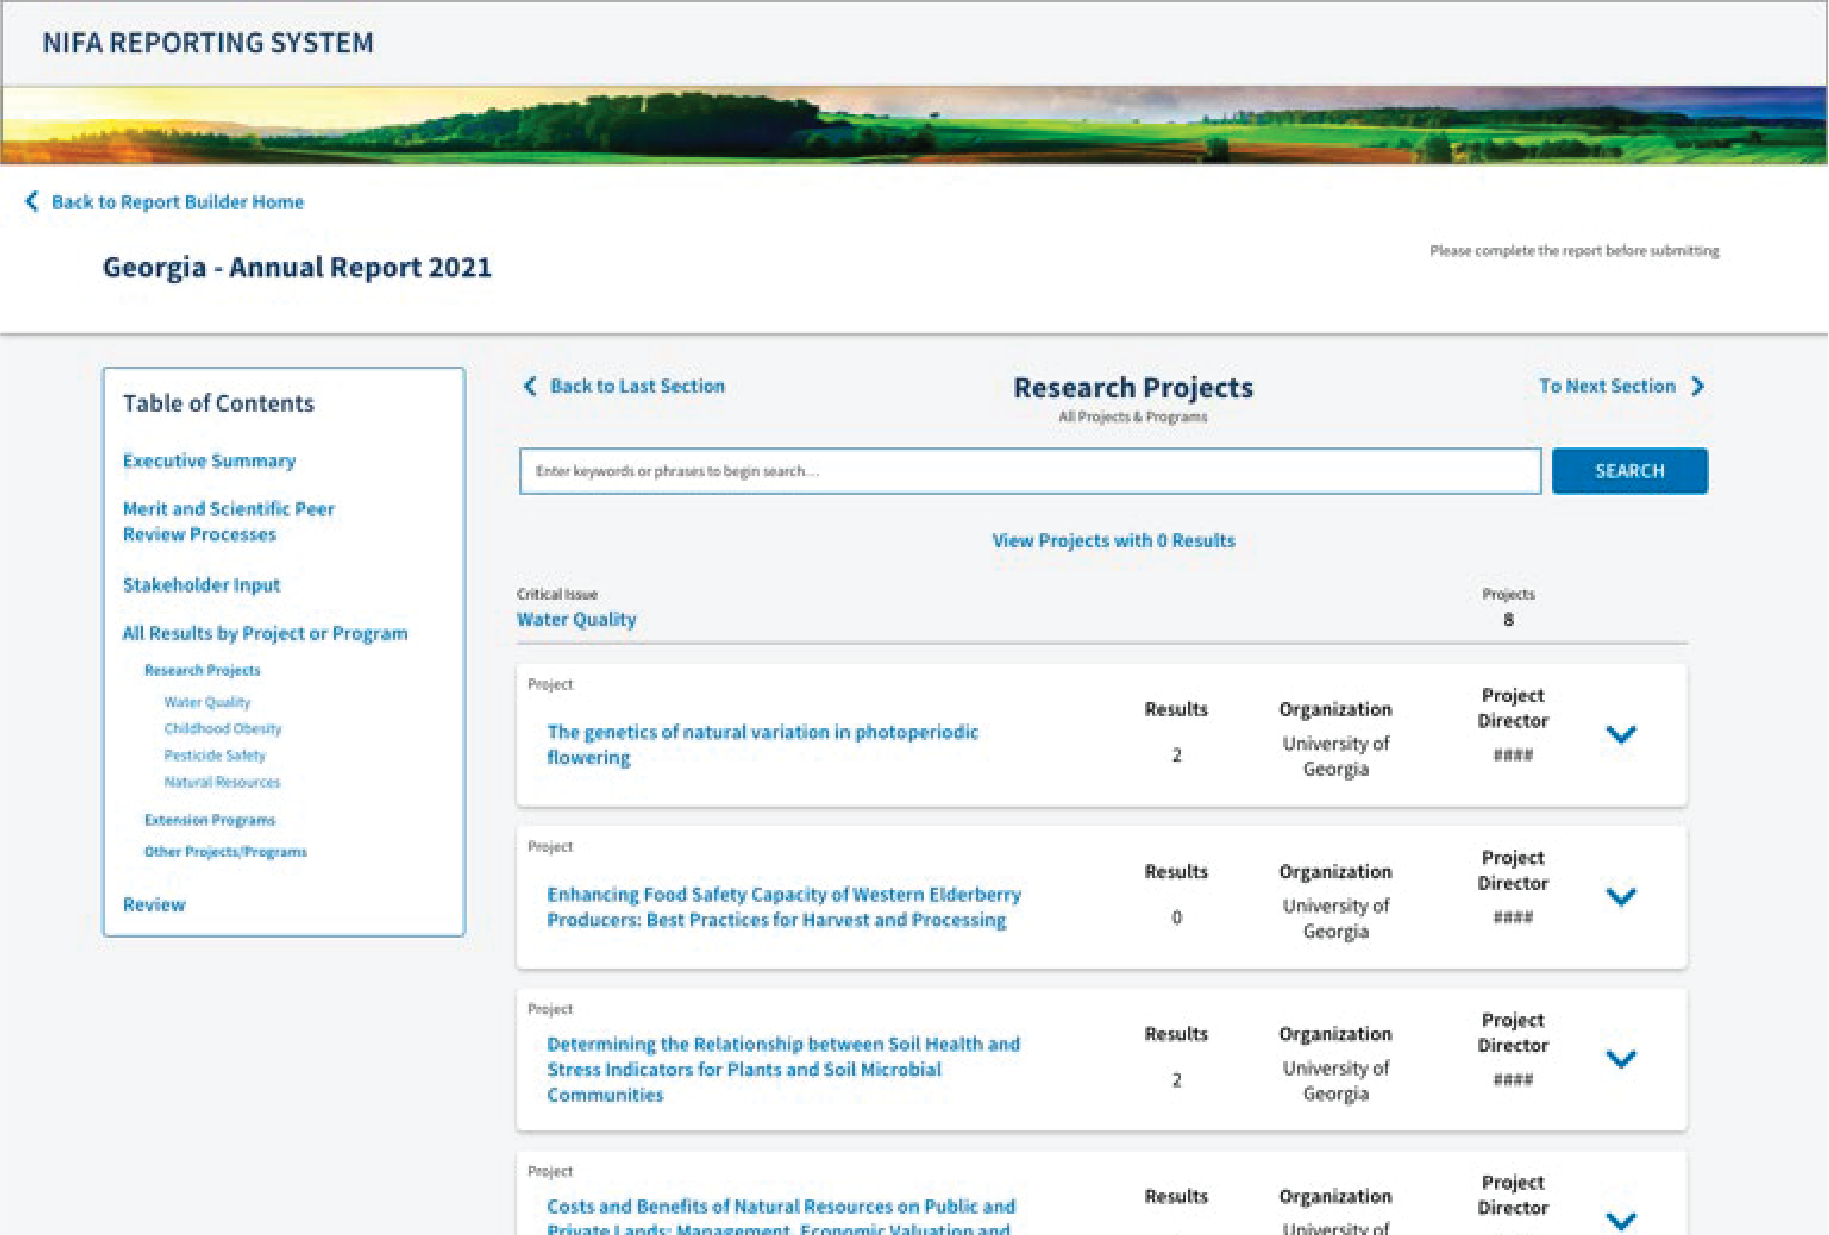
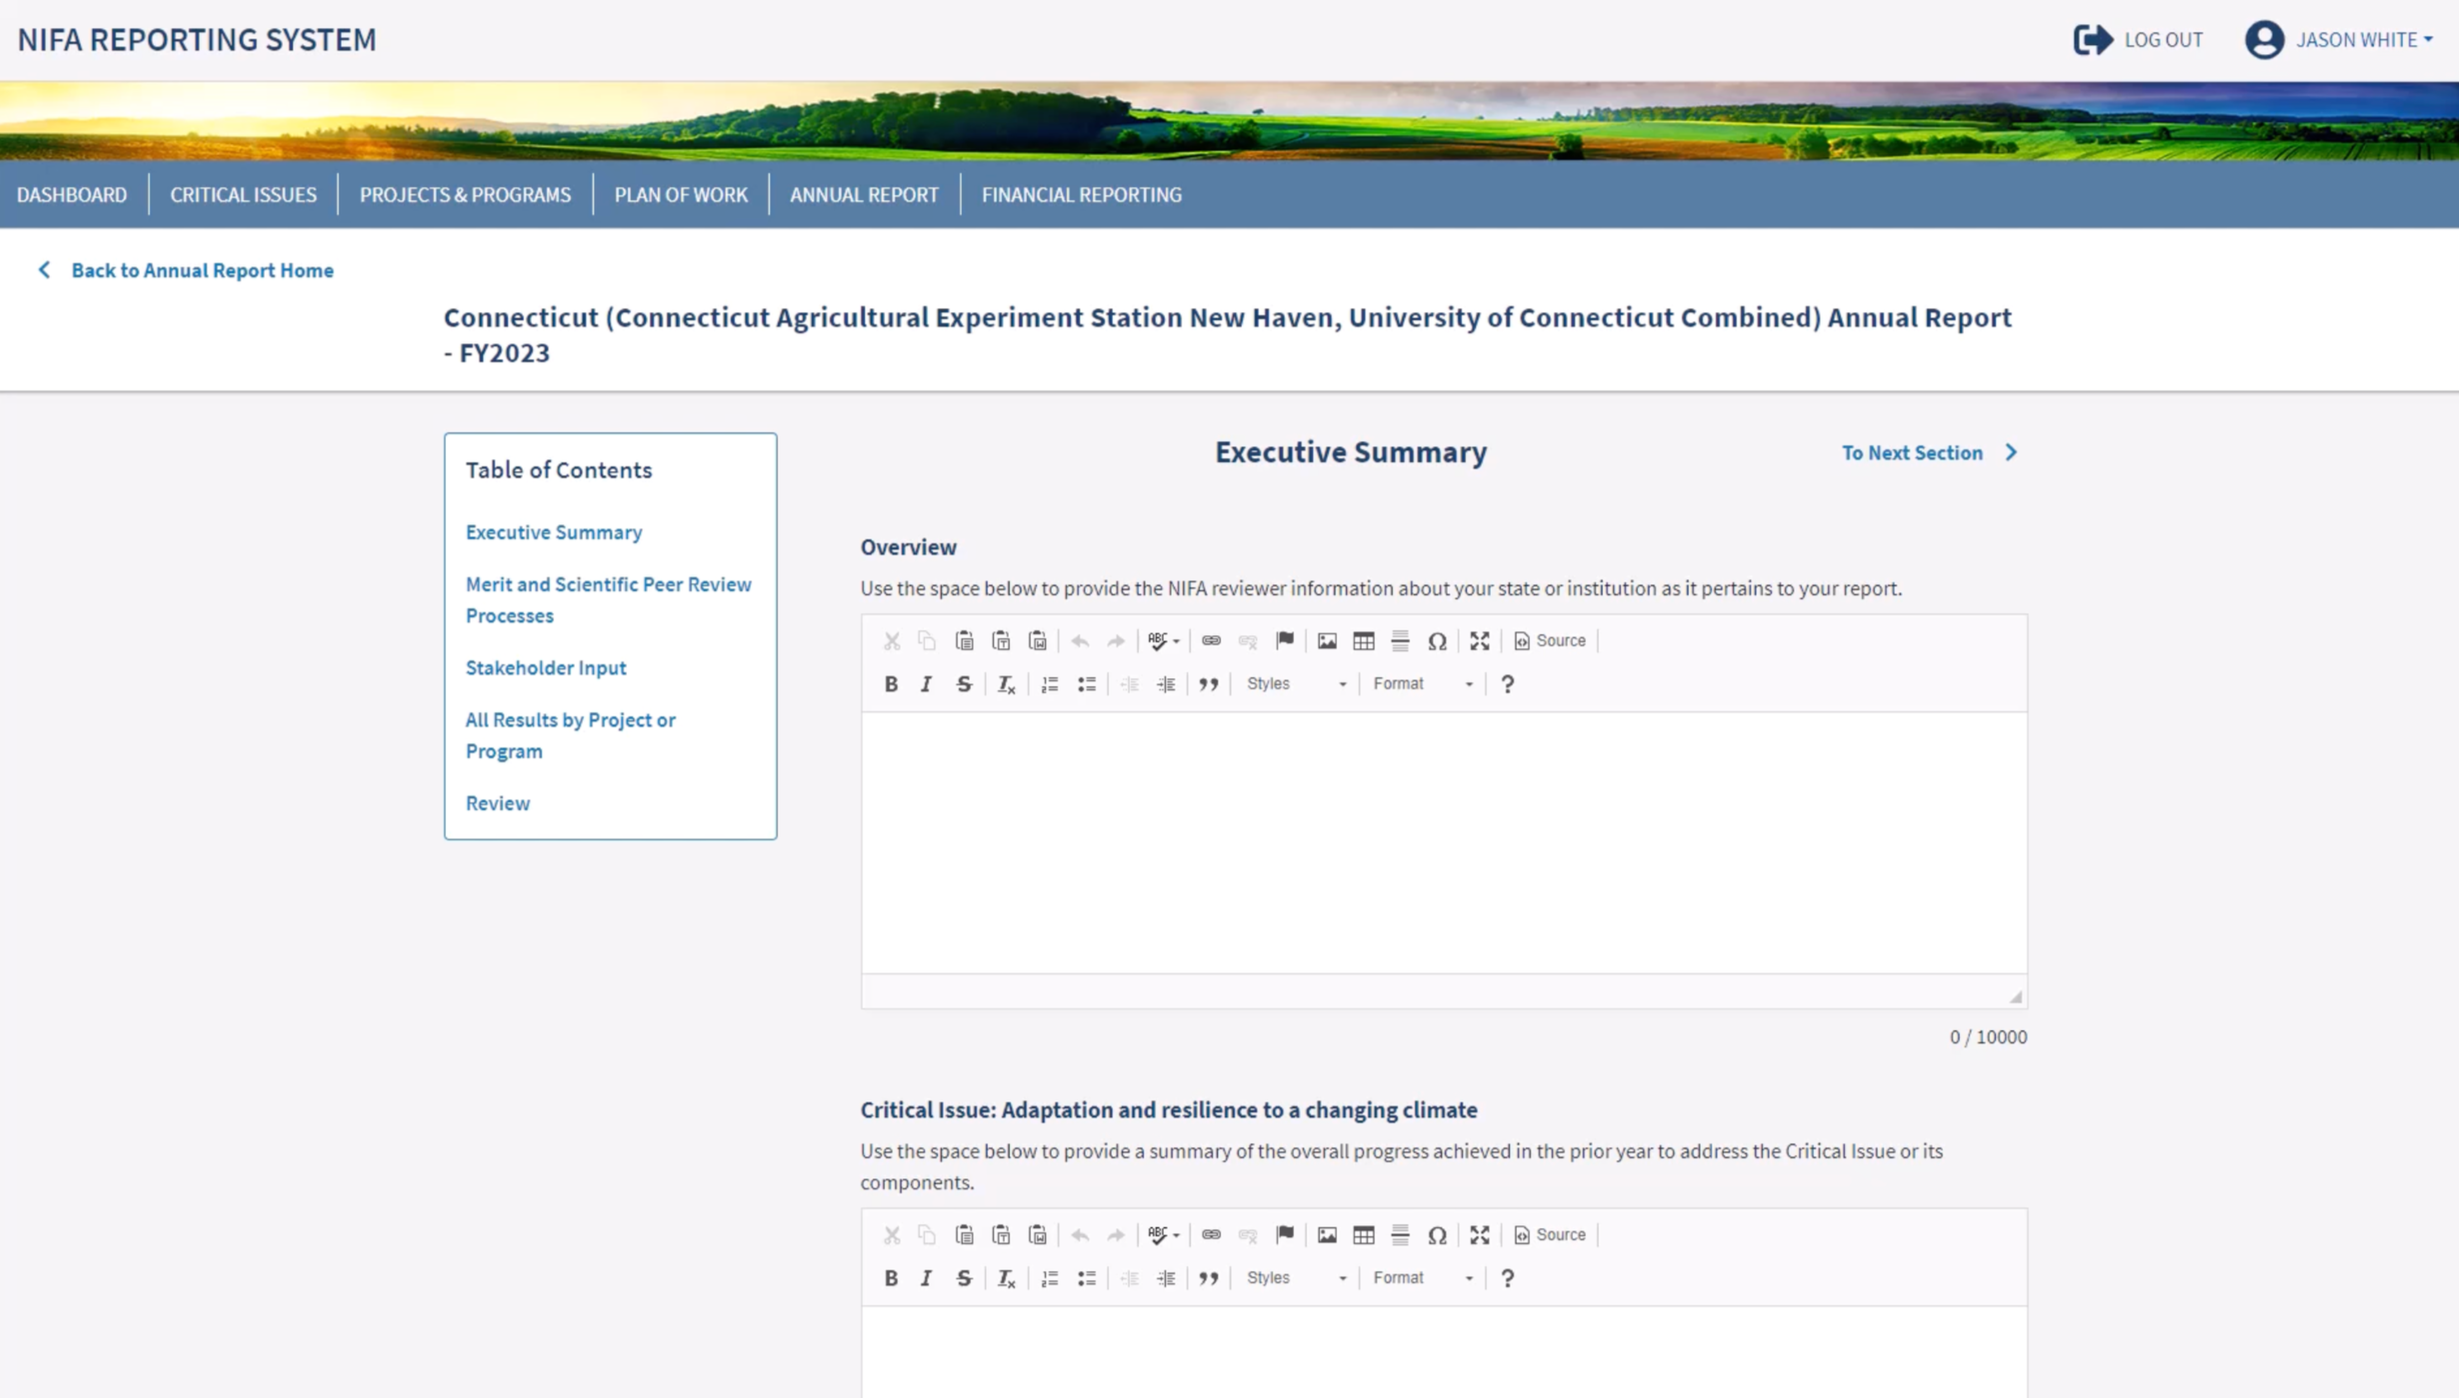
Annual Report Experience
View a video walkthrough of this experience:
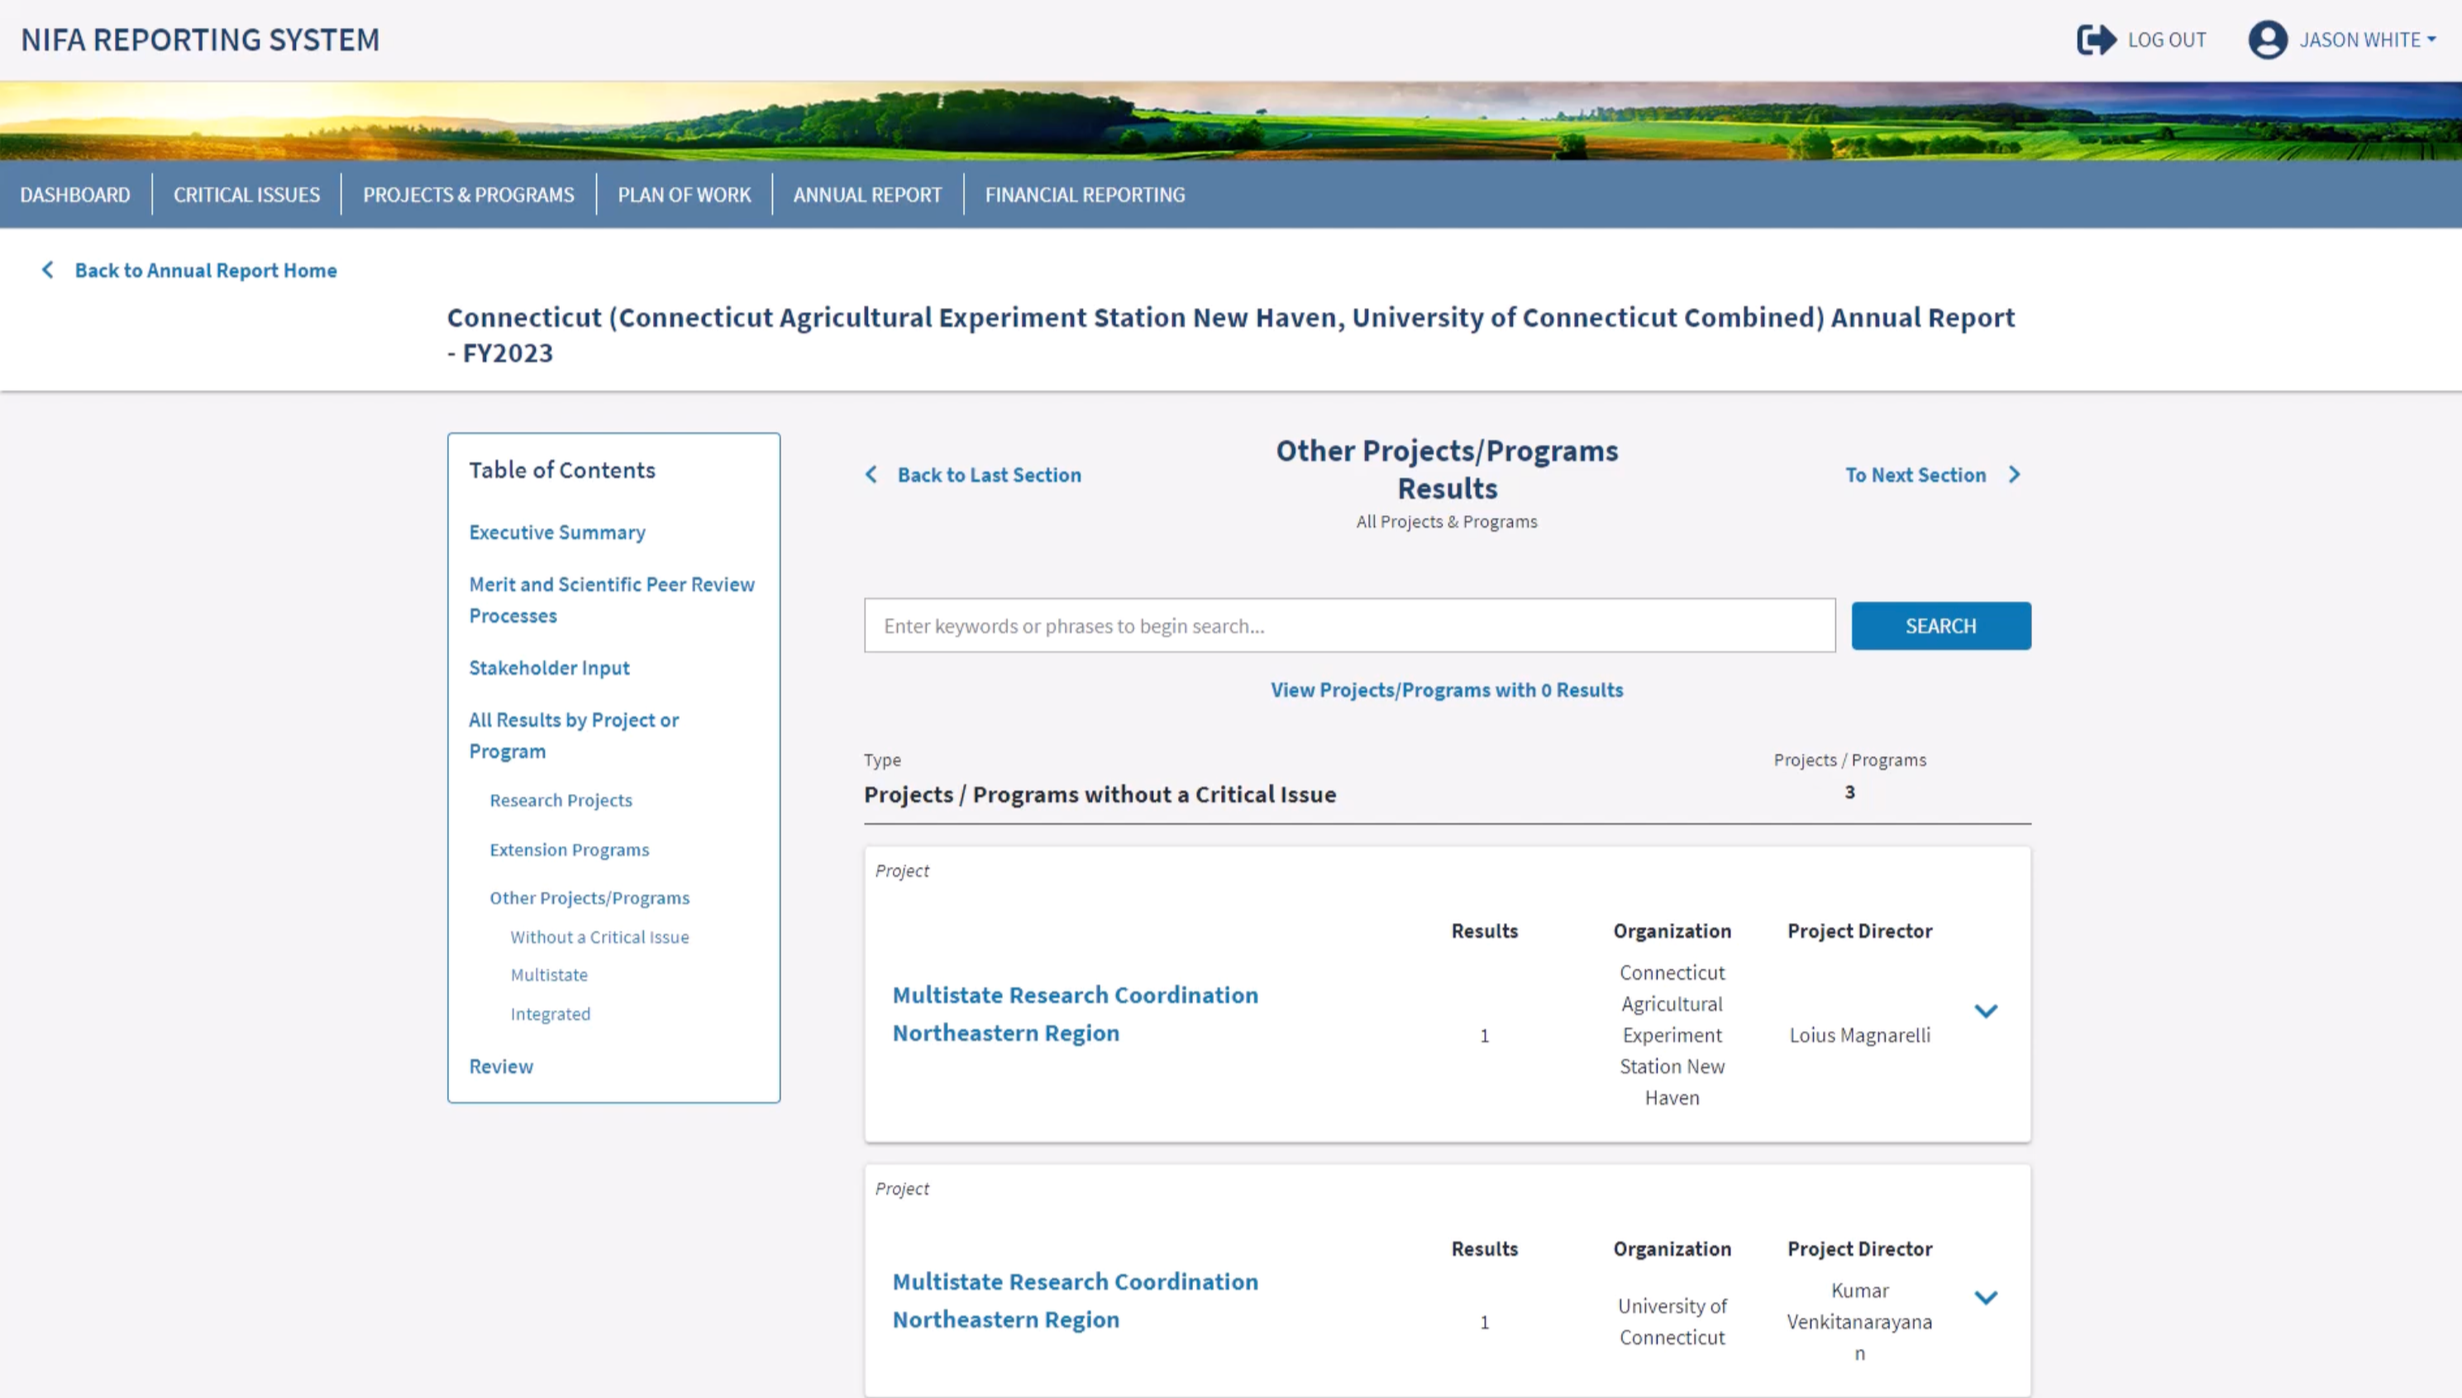
Due to the fluid nature of the system, there are several edge cases where a project or a program could not be attached to a Critical Issue (Orphaned), or is part of a Multistate or Interstate project. This third section of the report contains all of those edge case reports.
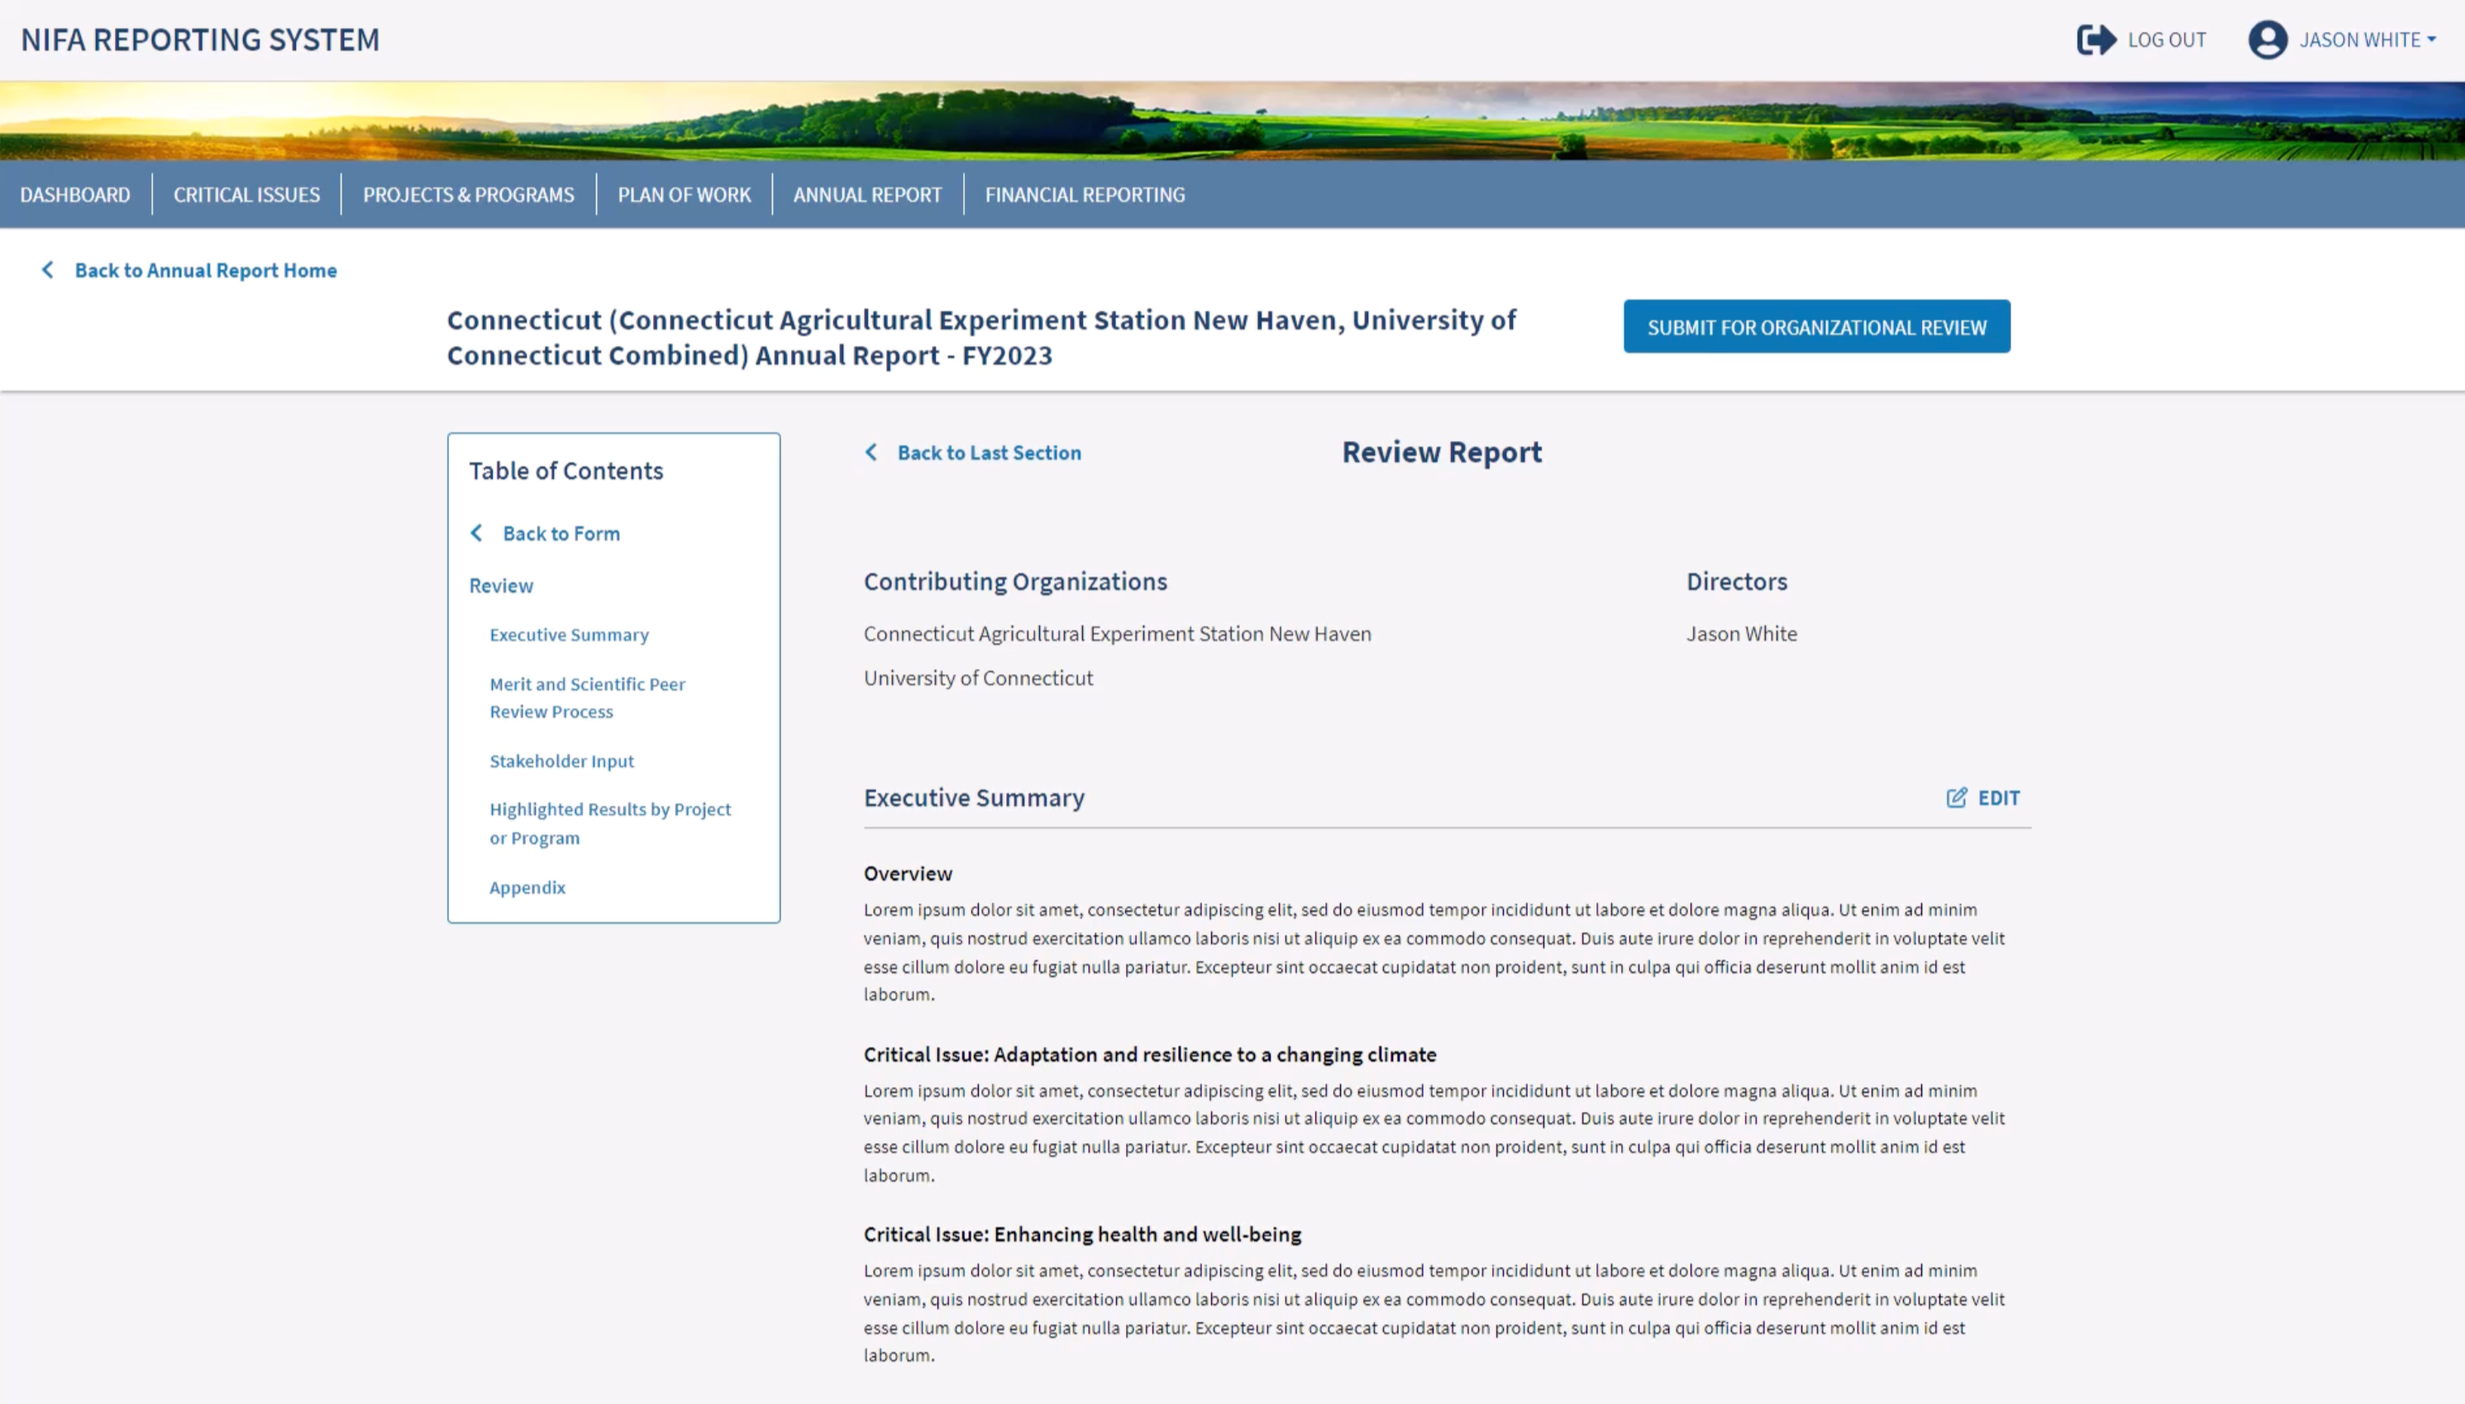
At the end of the experience, users are given the opportunity to review the report in full, formatted in the same way that it would be shown to the reviewers at NIFA. The Table of Contents sticks to the top of the page, and scrolls with the user for ease of use.
Description here of what the Annual Report is
Describe design process here for how I decided to organize the plan of work — D&D Beyond as inspo
If a project or program that was active during the year had a highlighted Result (from the Projects/Programs overview page), the highlighted results appear in the Annual Report.
Describe how research projects/extension programs are recorded here for year end review
Plan of Work Experience
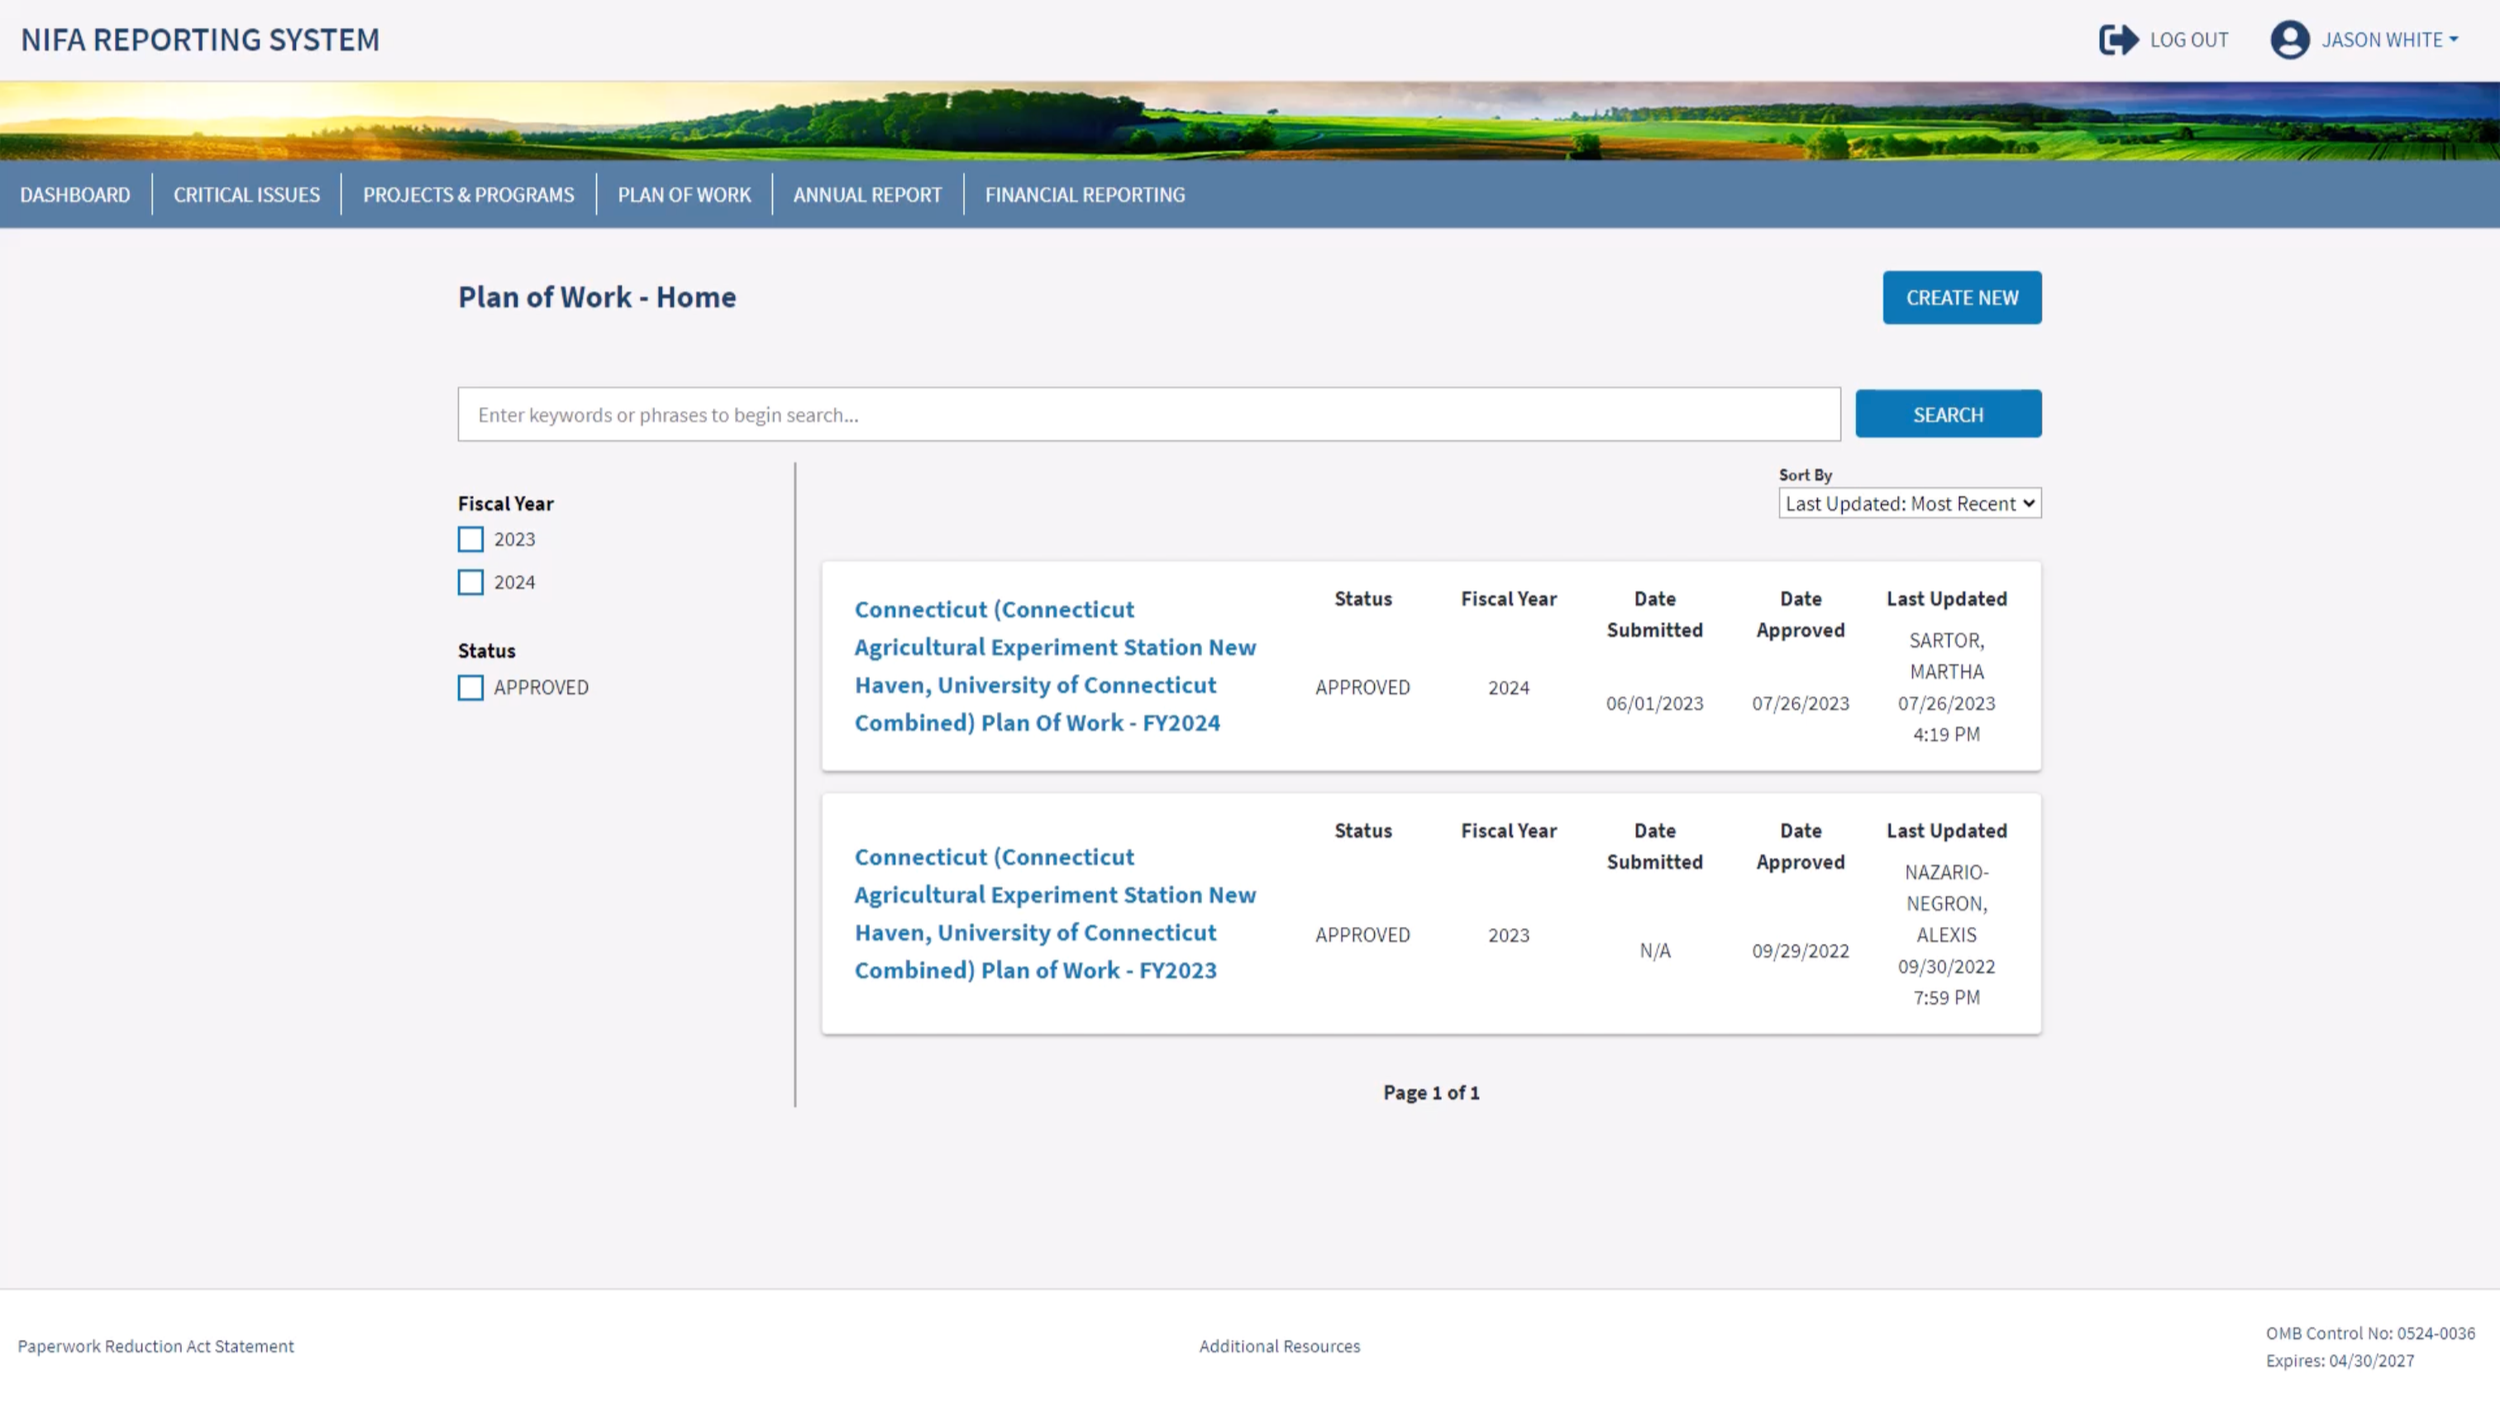
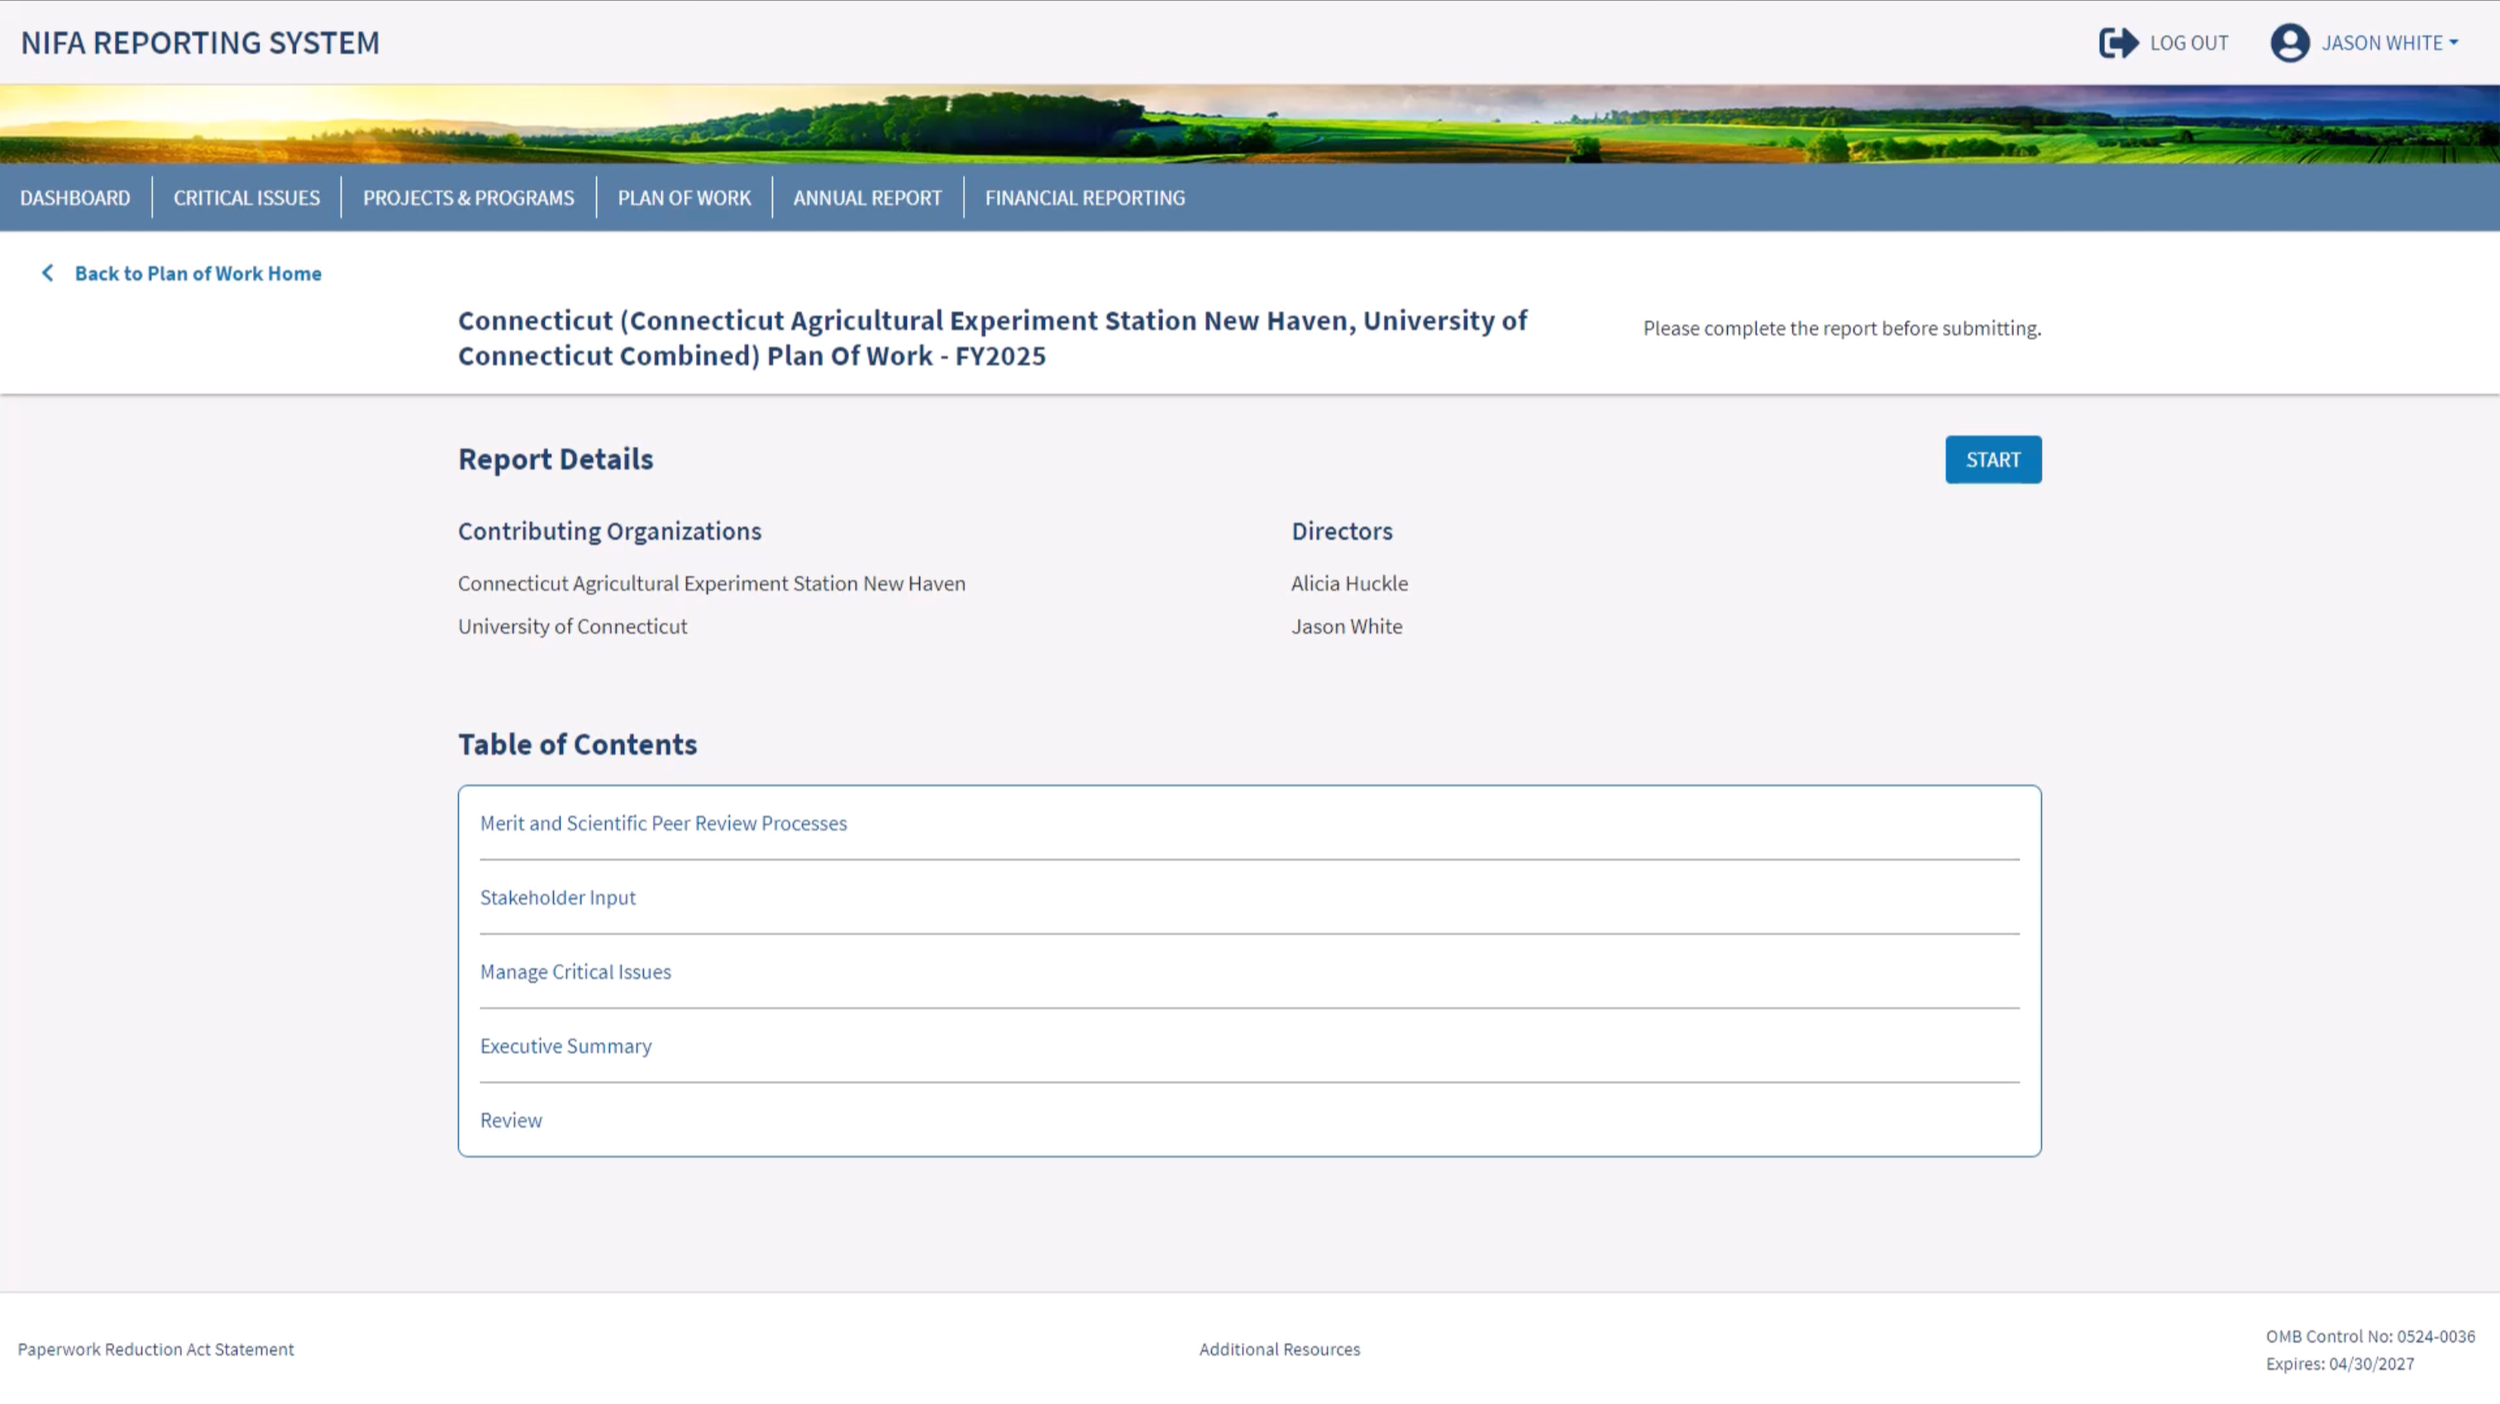
Beginning a new report experience
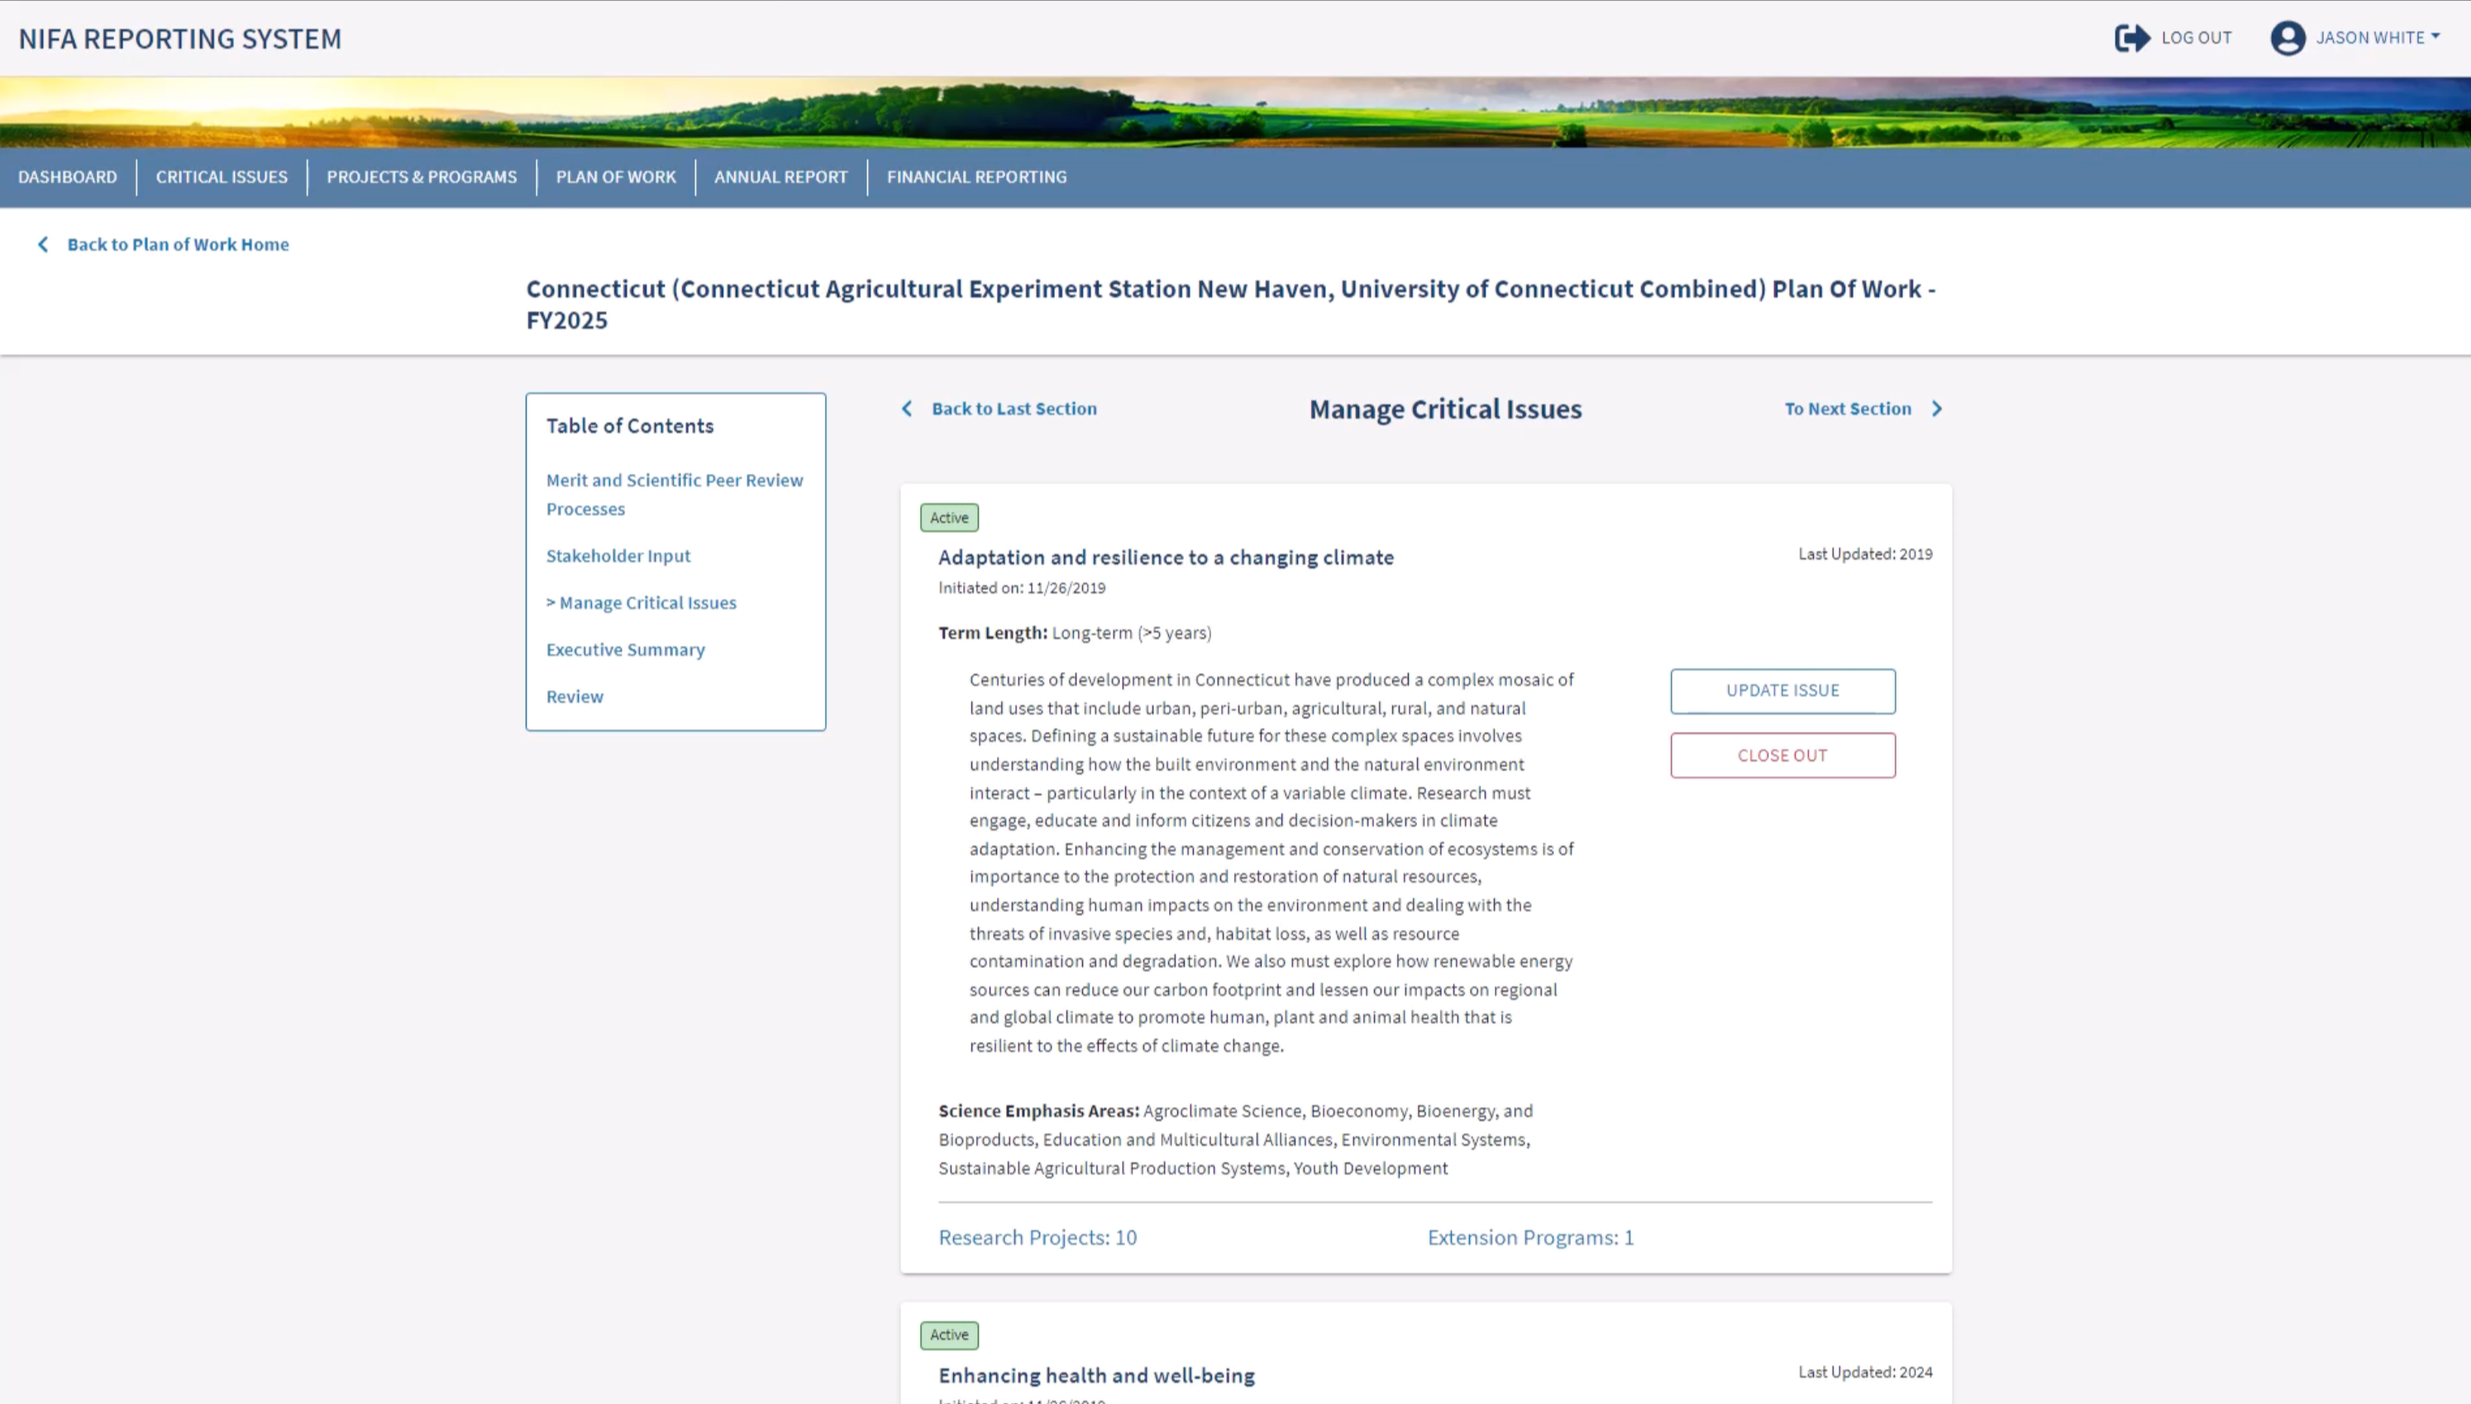
Plan of work is the report where Universities are able to update, close, or create new Critical Issues. This section of the Plan of work gives the user all of those options. For more ease of visibility, we added a count and button for users to be able to see how many projects/programs are associated with each active Critical Issue. Clicking on the button, opens a modal with a full list of the associated Projects and Programs.
Describe plan of work experience & reason they do it
Plan of Work report starts the year, Annual Report finishes out the year
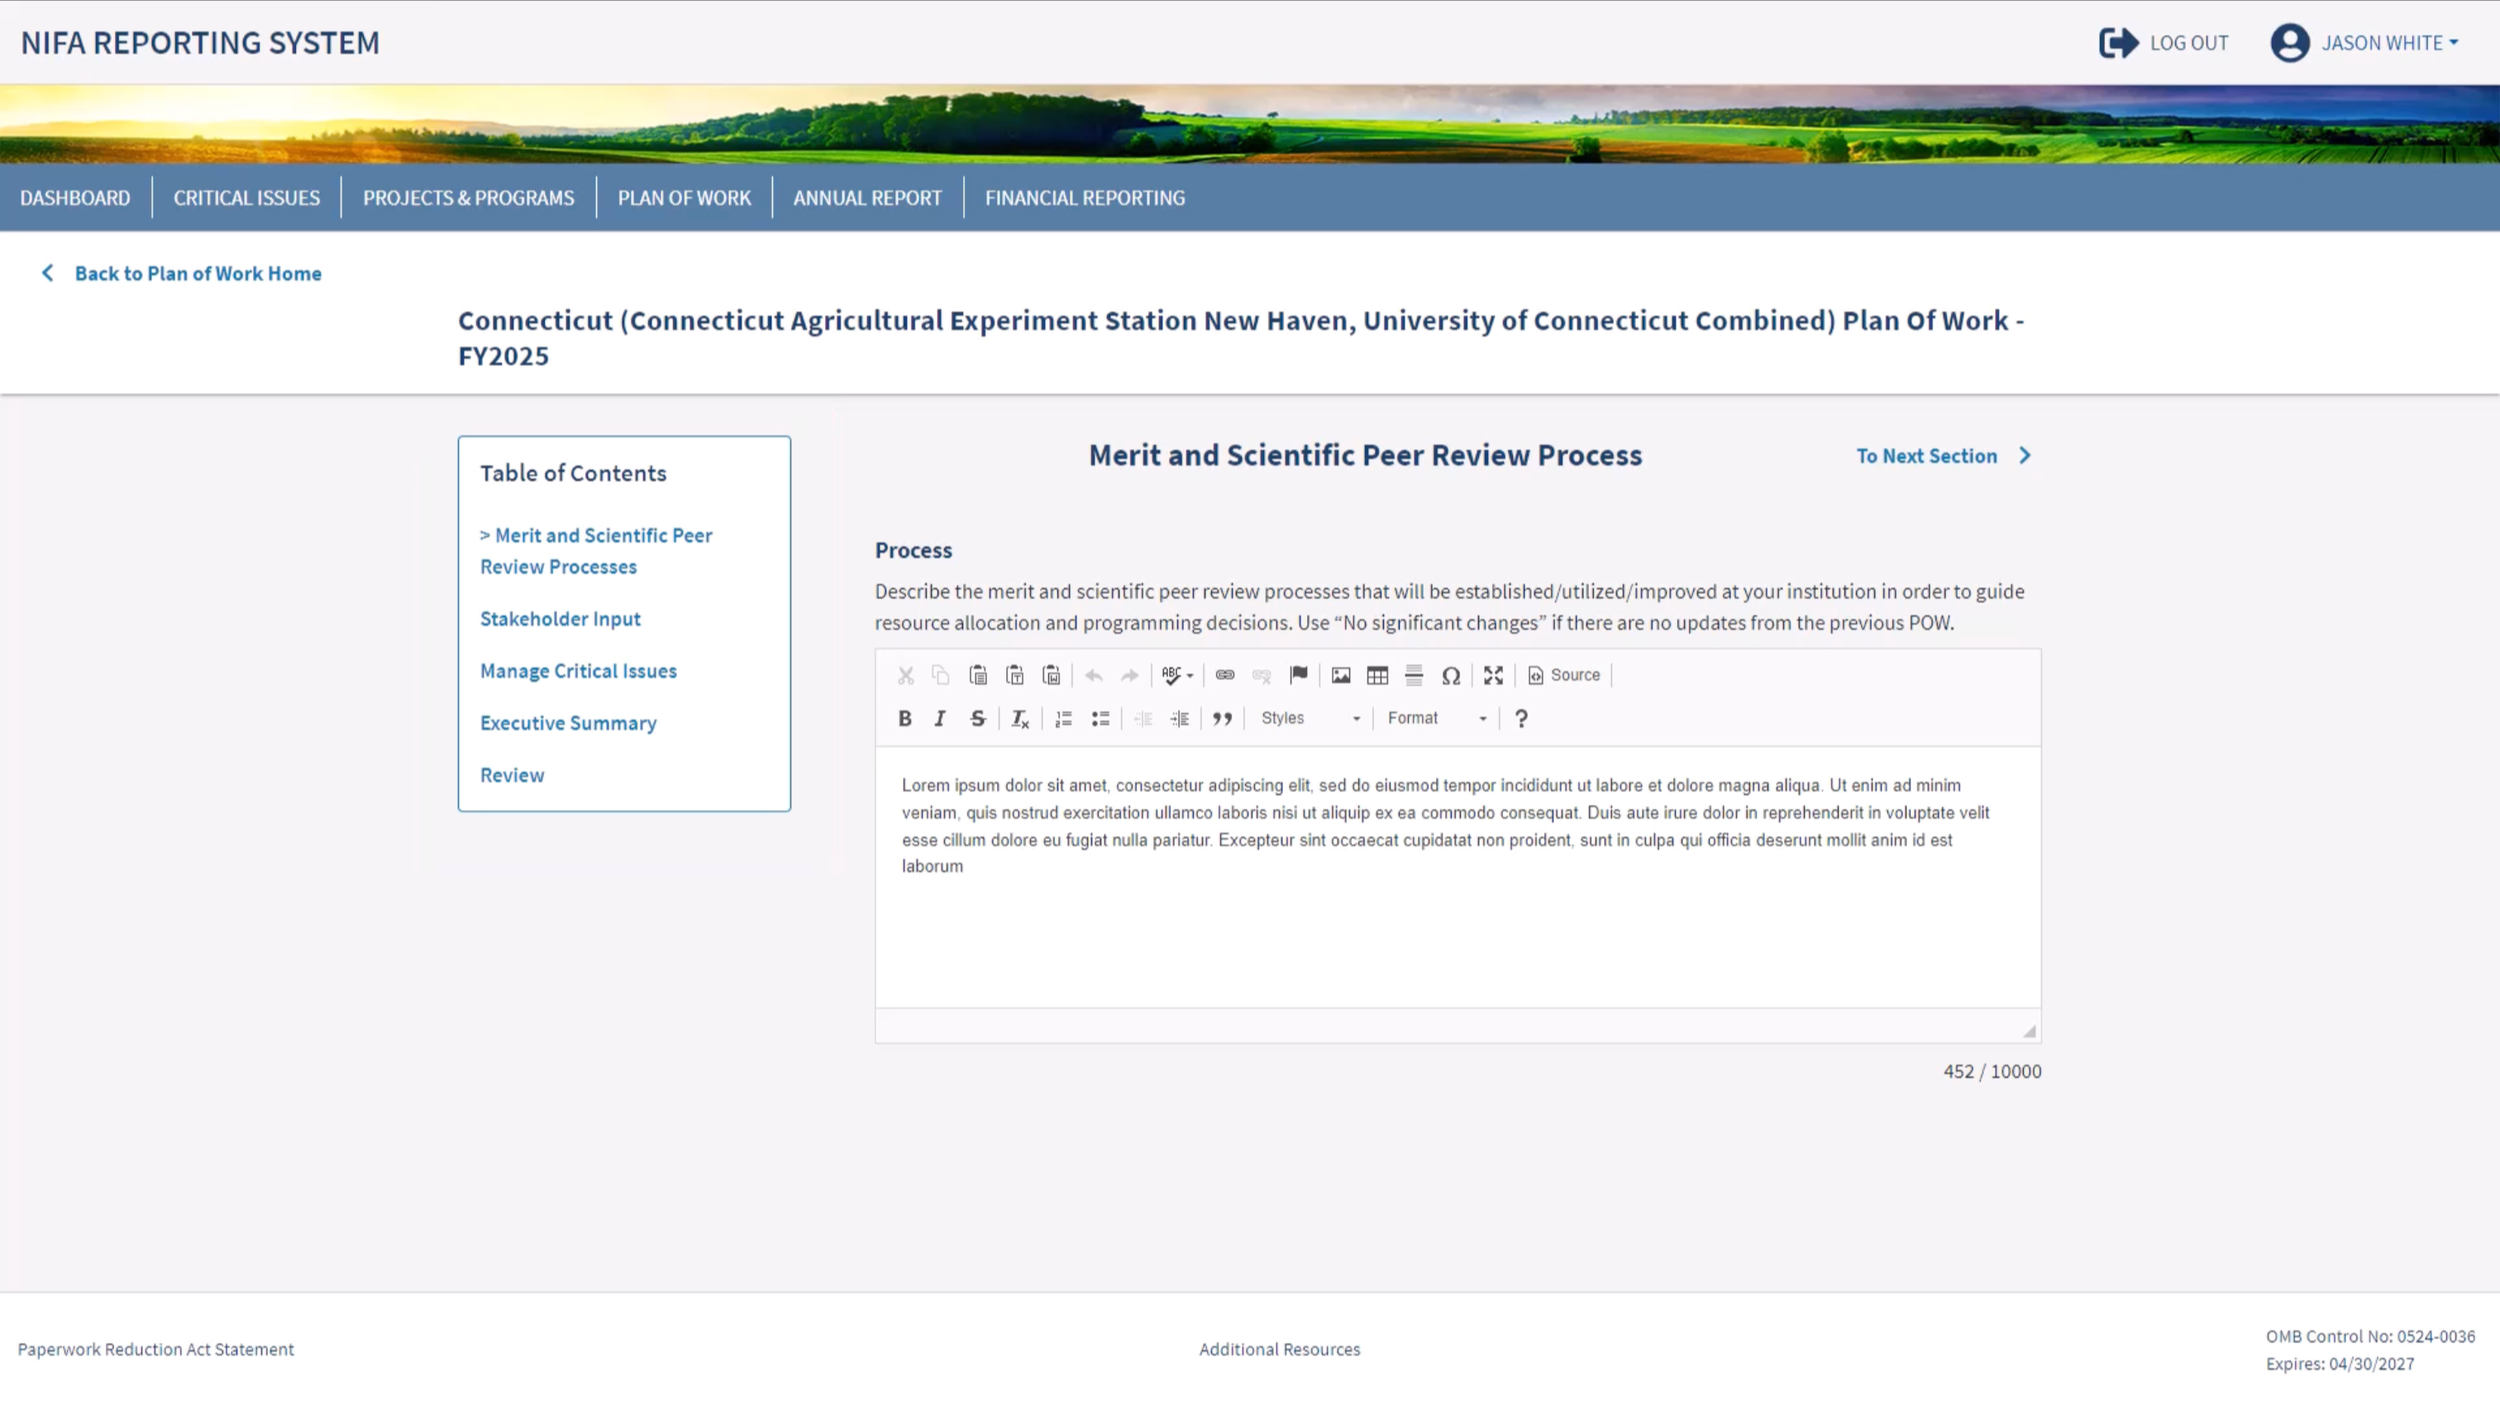
Experience matches the Annual Report experience
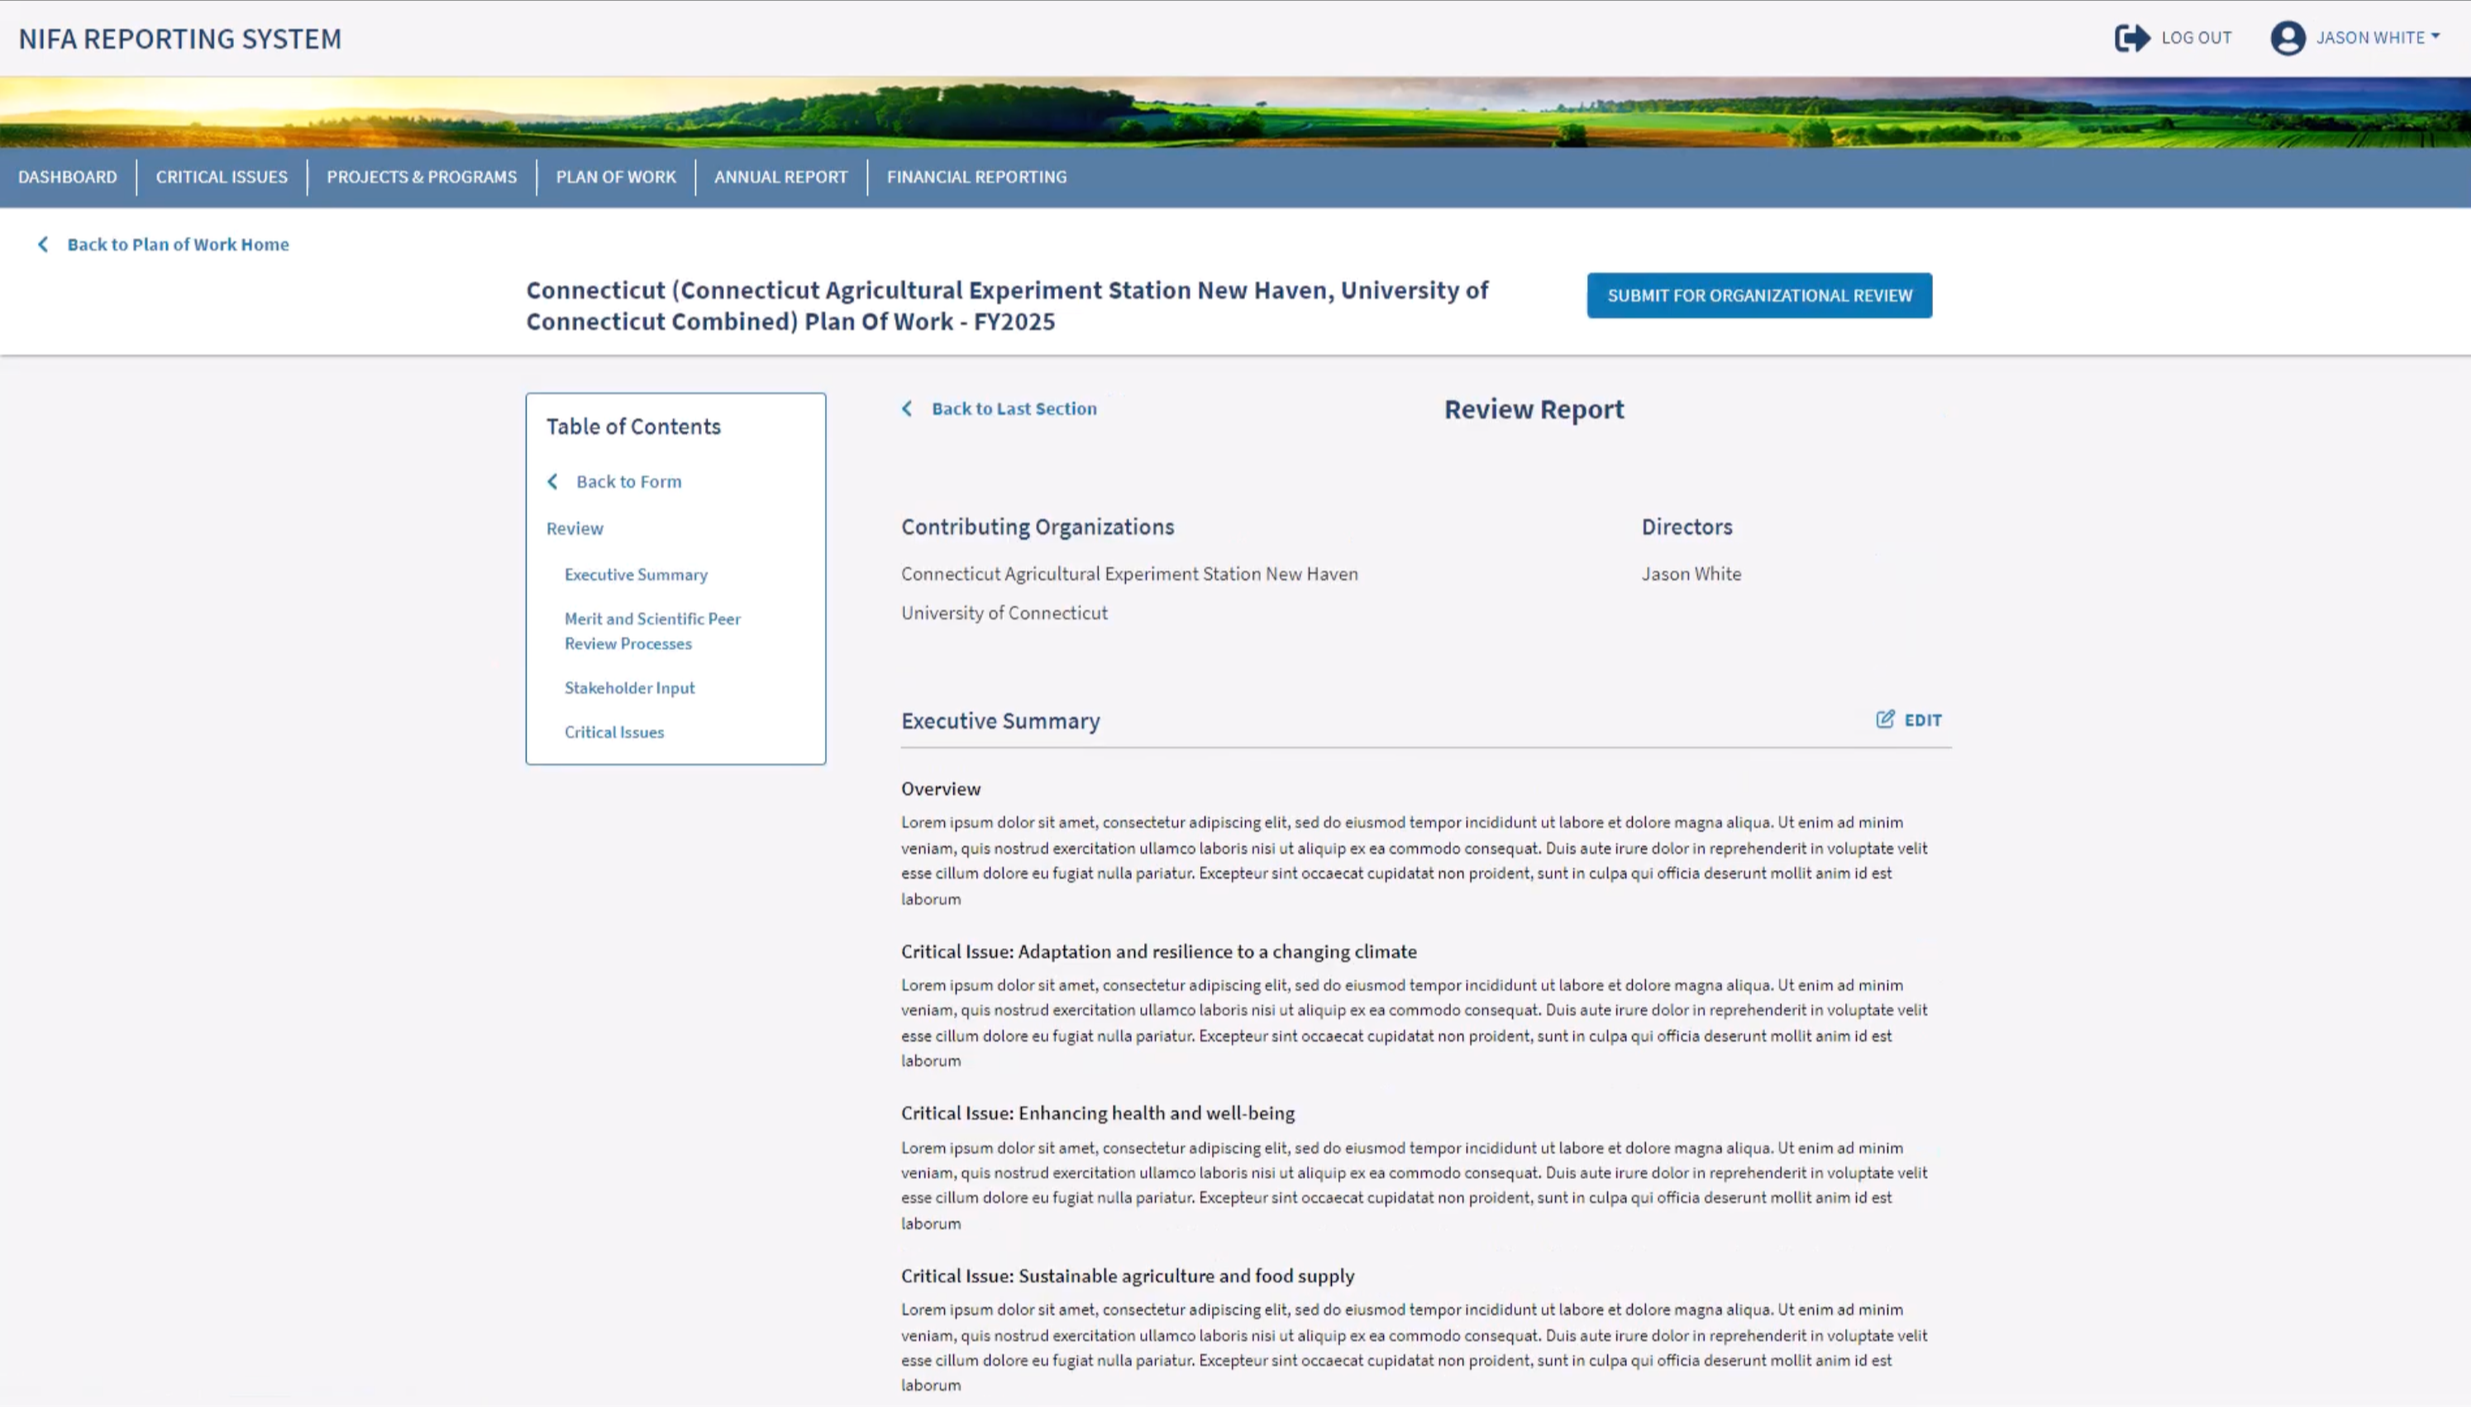
Following the same pattern as the Annual Report, we allow the user to review the full Plan of Work report, formatted as exactly as it will appear to the reviewers at NIFA.
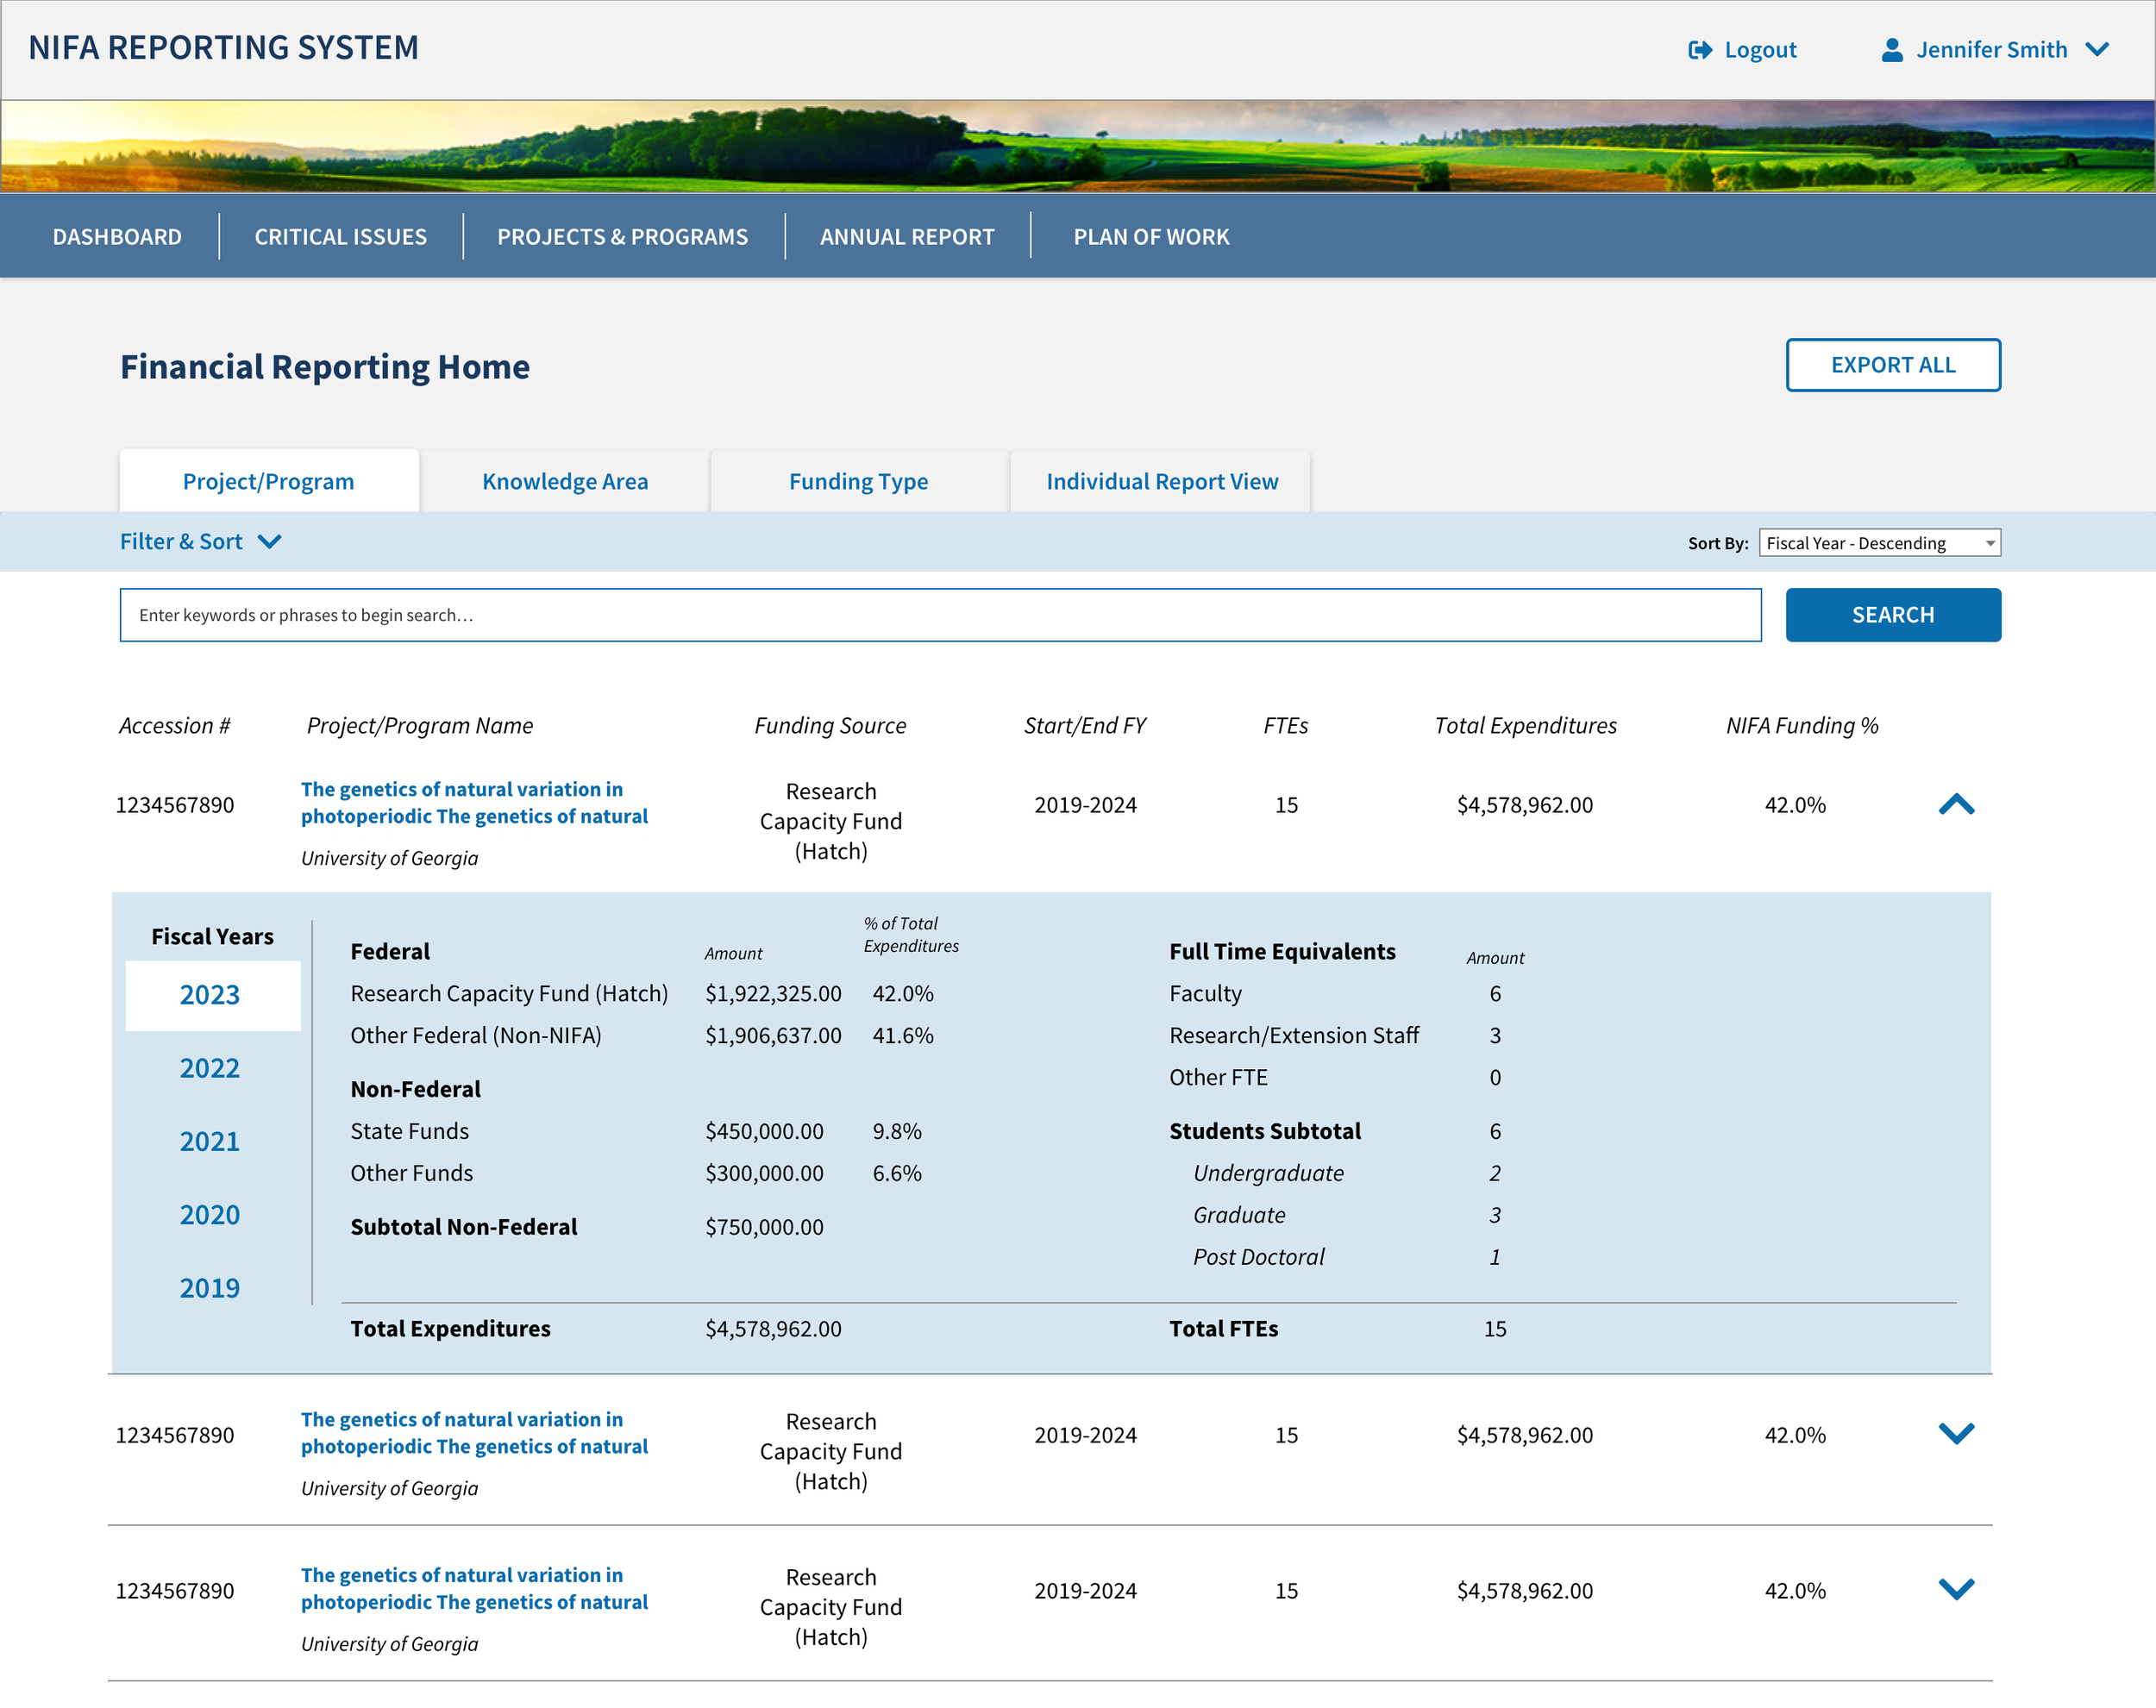
Financial Module (NIFA side)
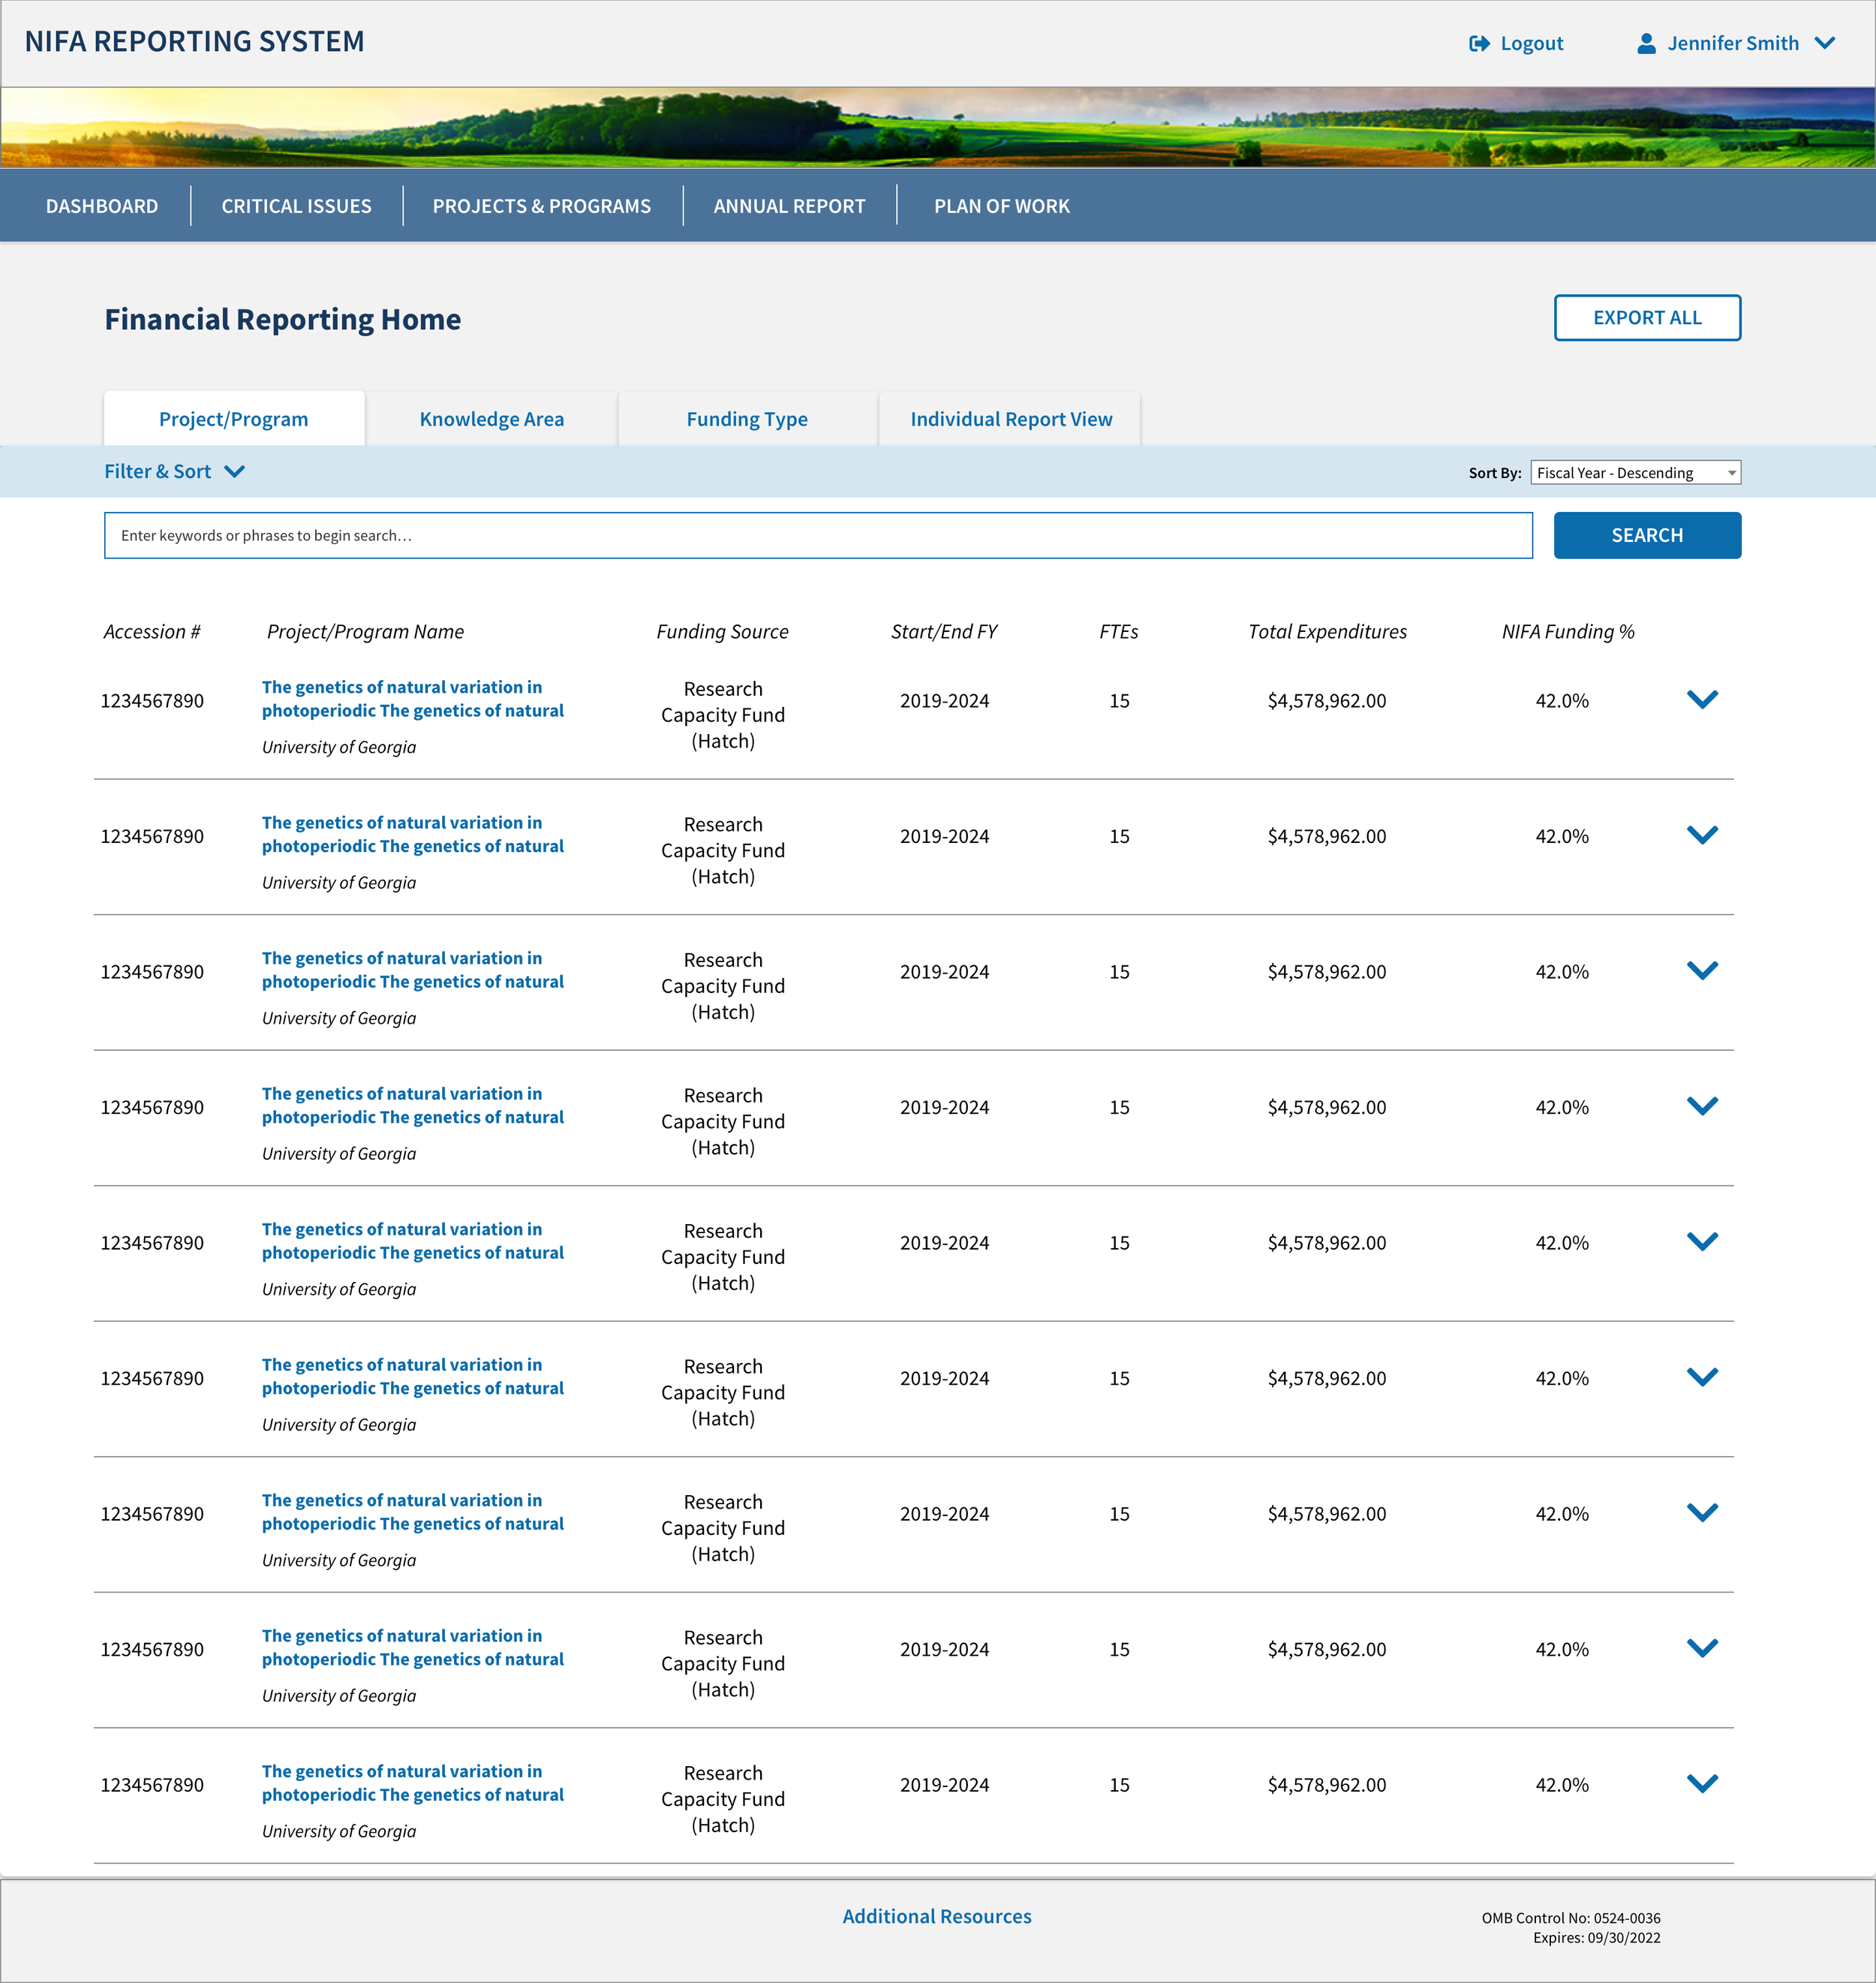
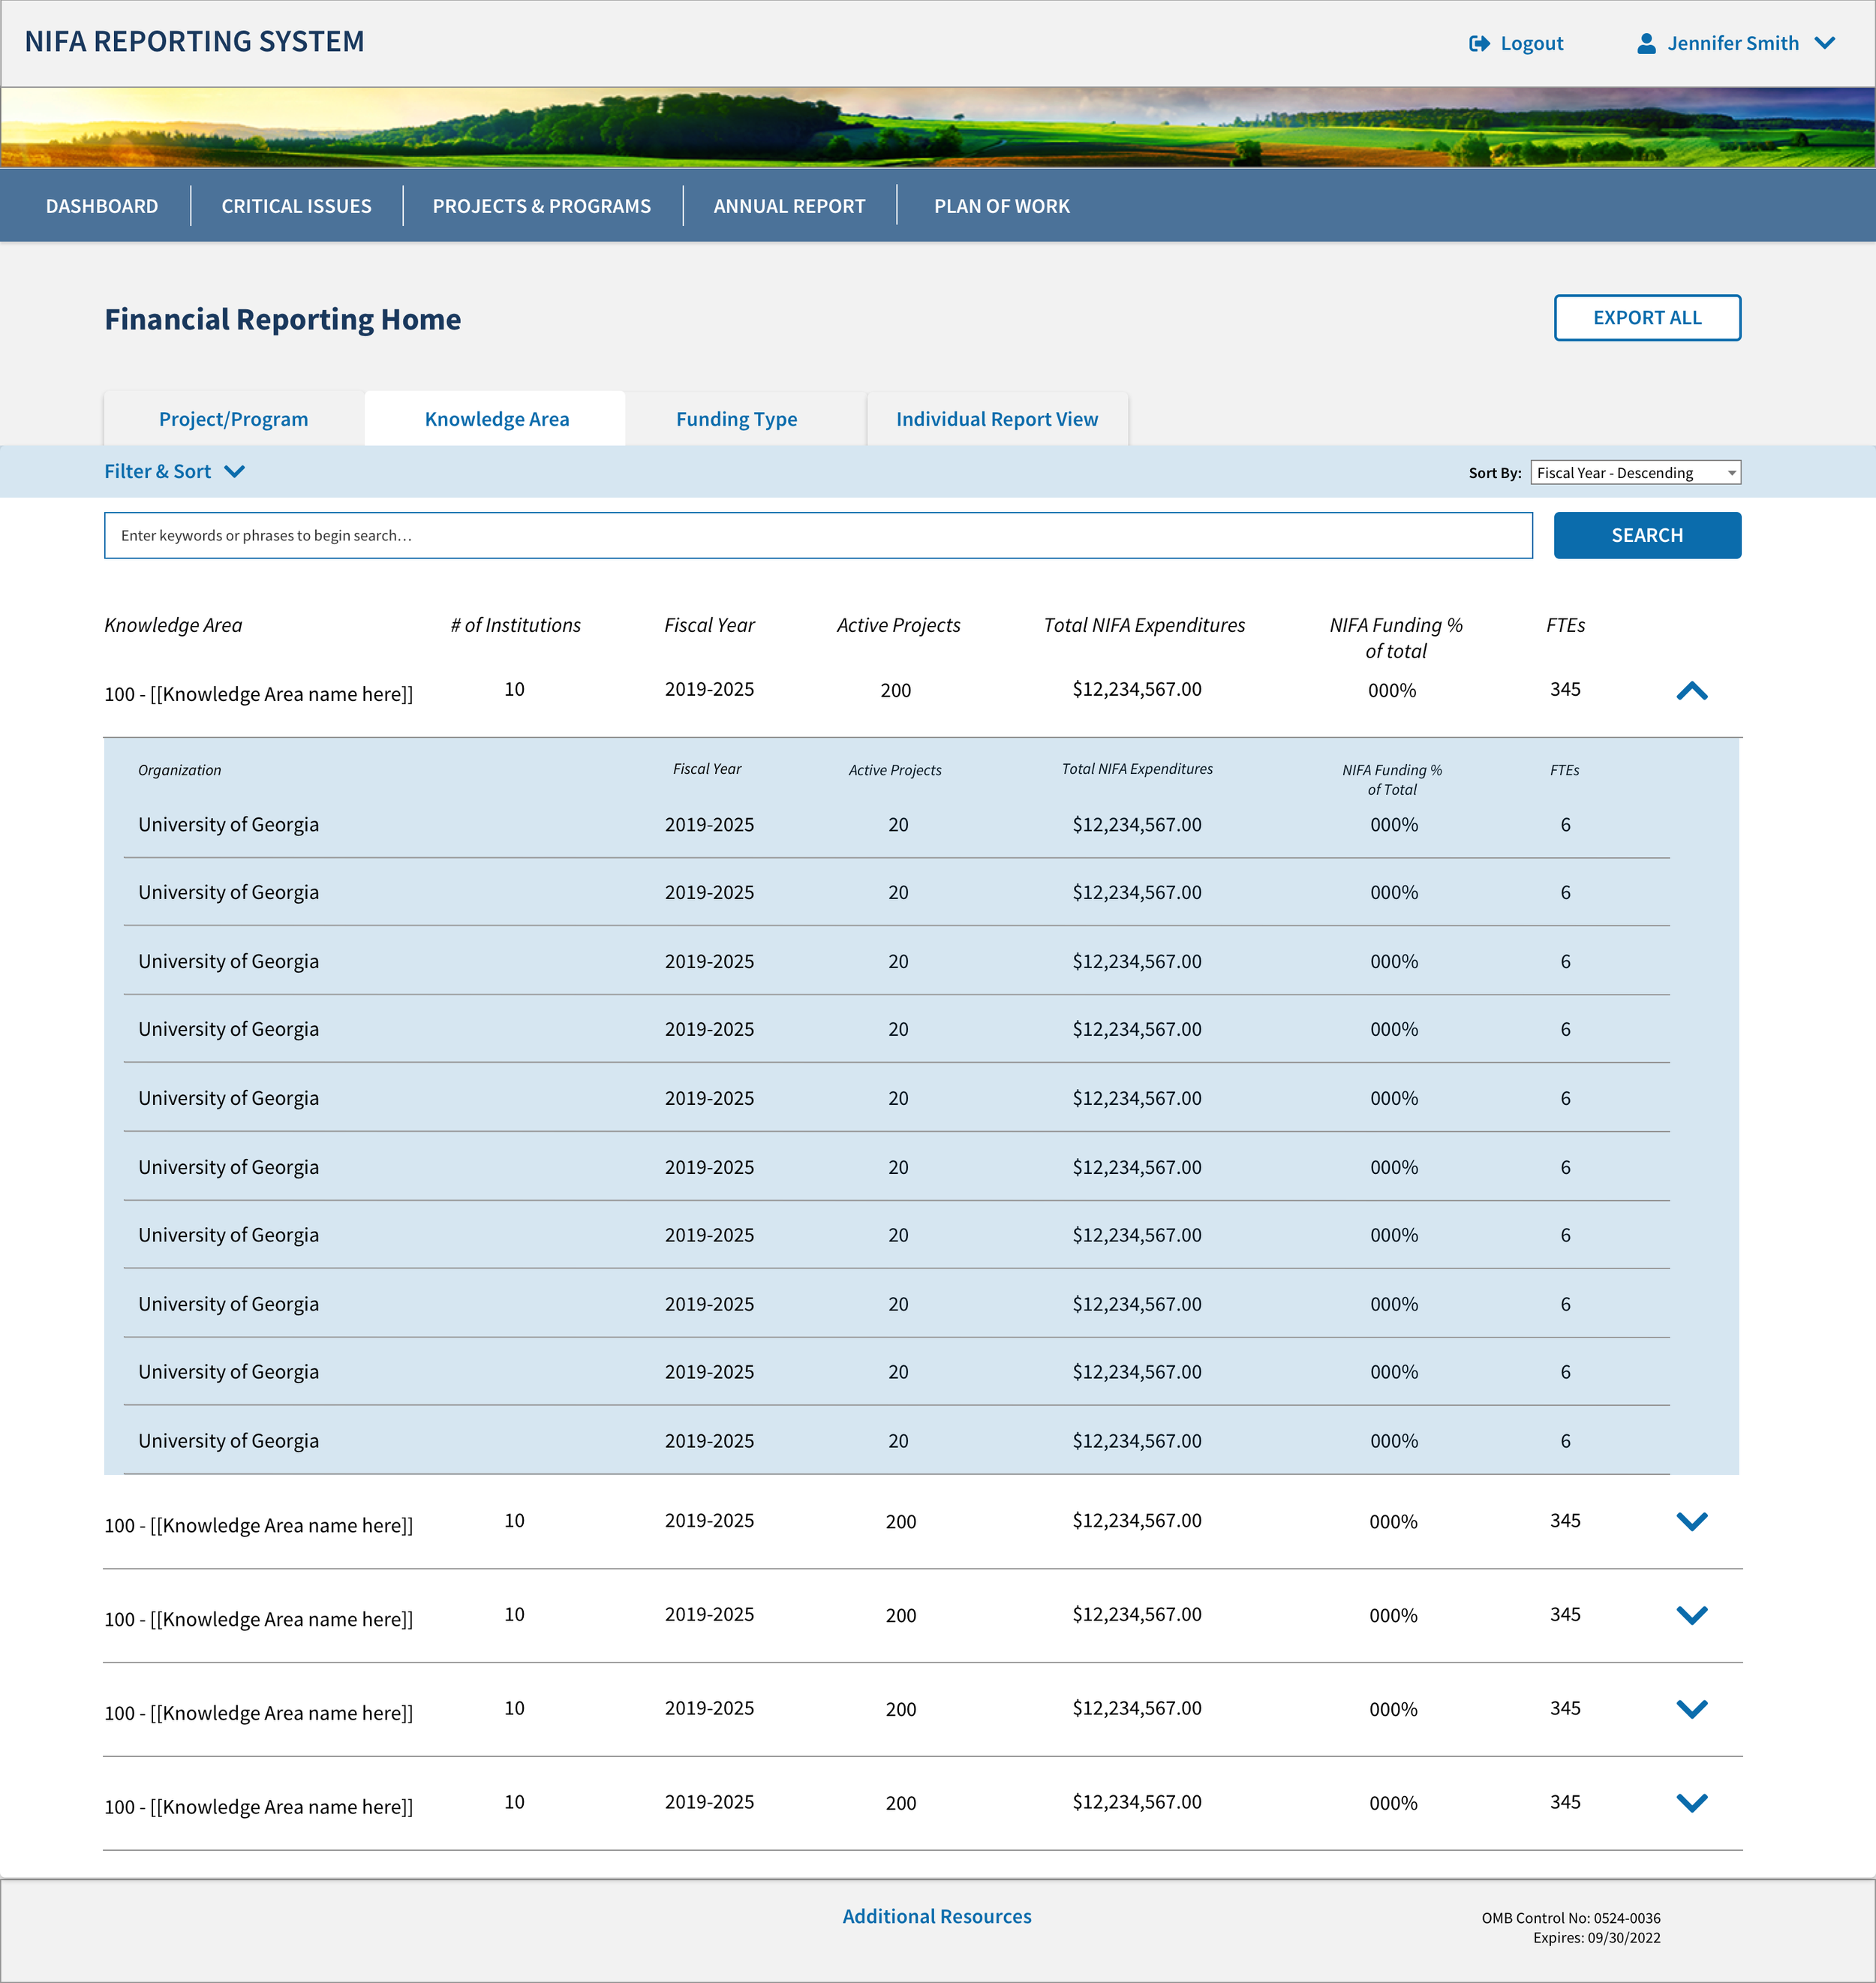
Description here of the financial report that each University needs to file, and how NIFA needs to look at the reports
Each tab provides a different way to look at all of the data associate with a university
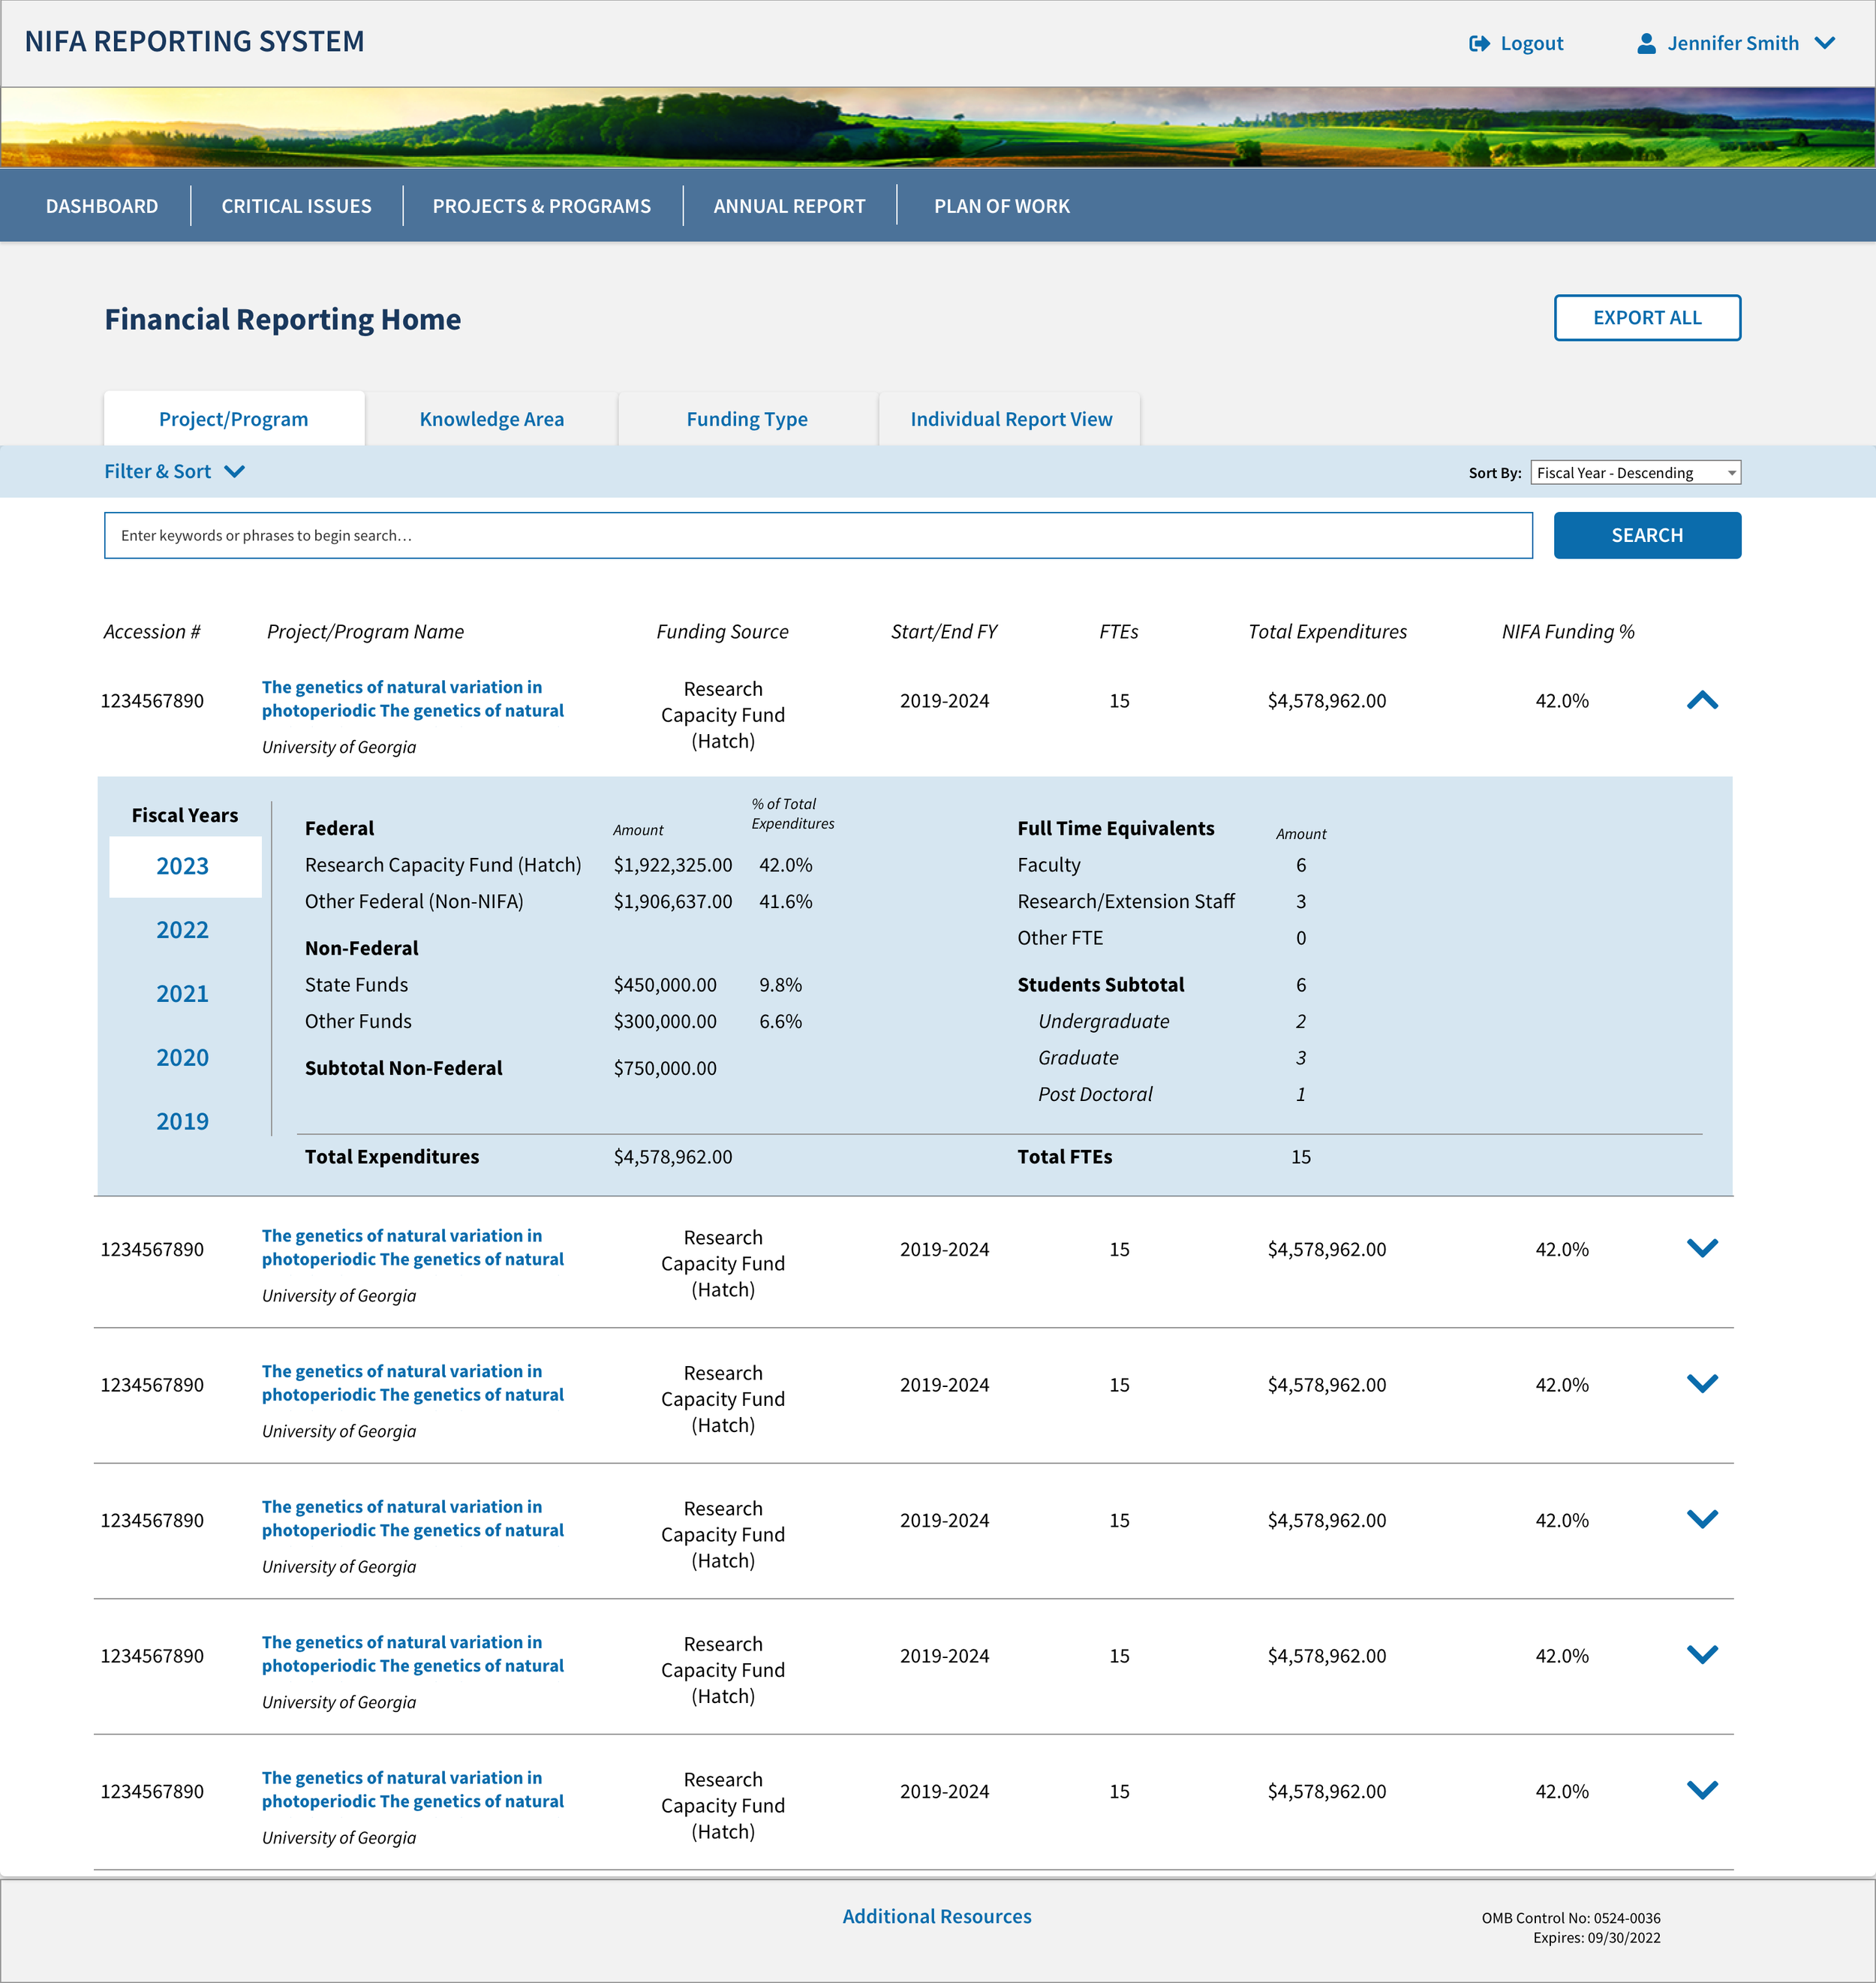
The first tab shows all financial information by project/program
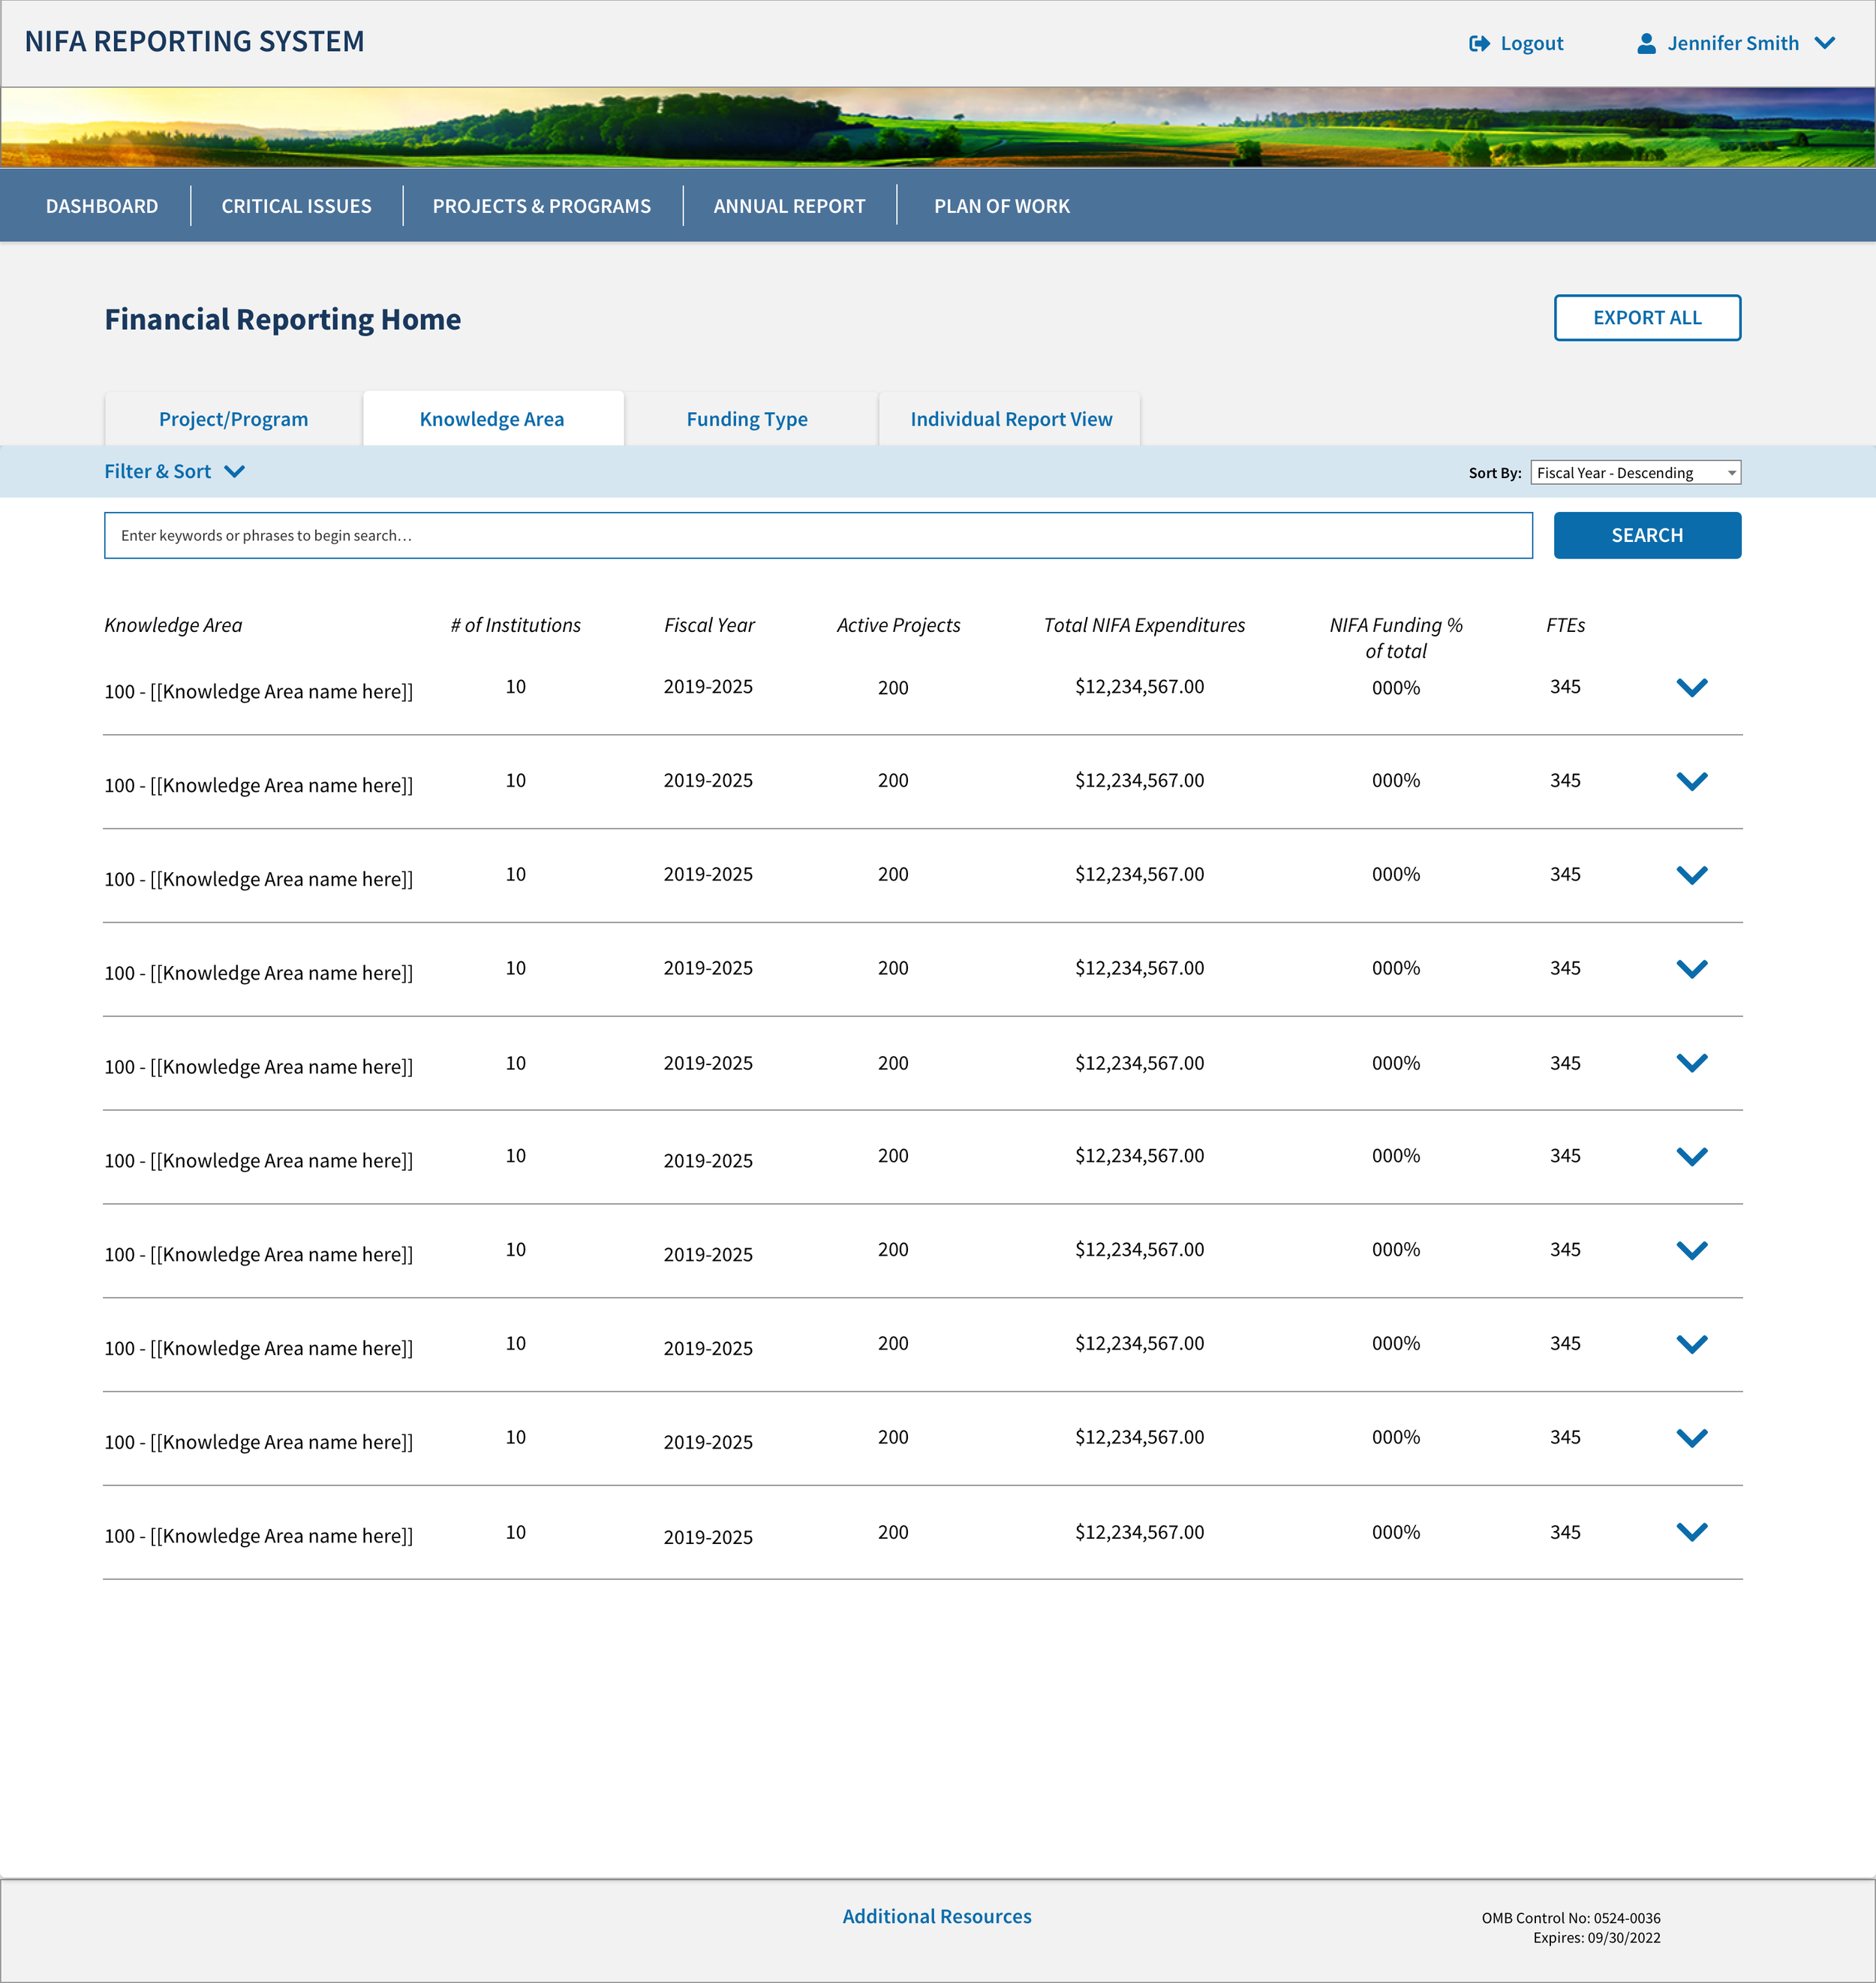
All projects and programs are assigned to a specific knowledge area. [explain Knowledge areas]
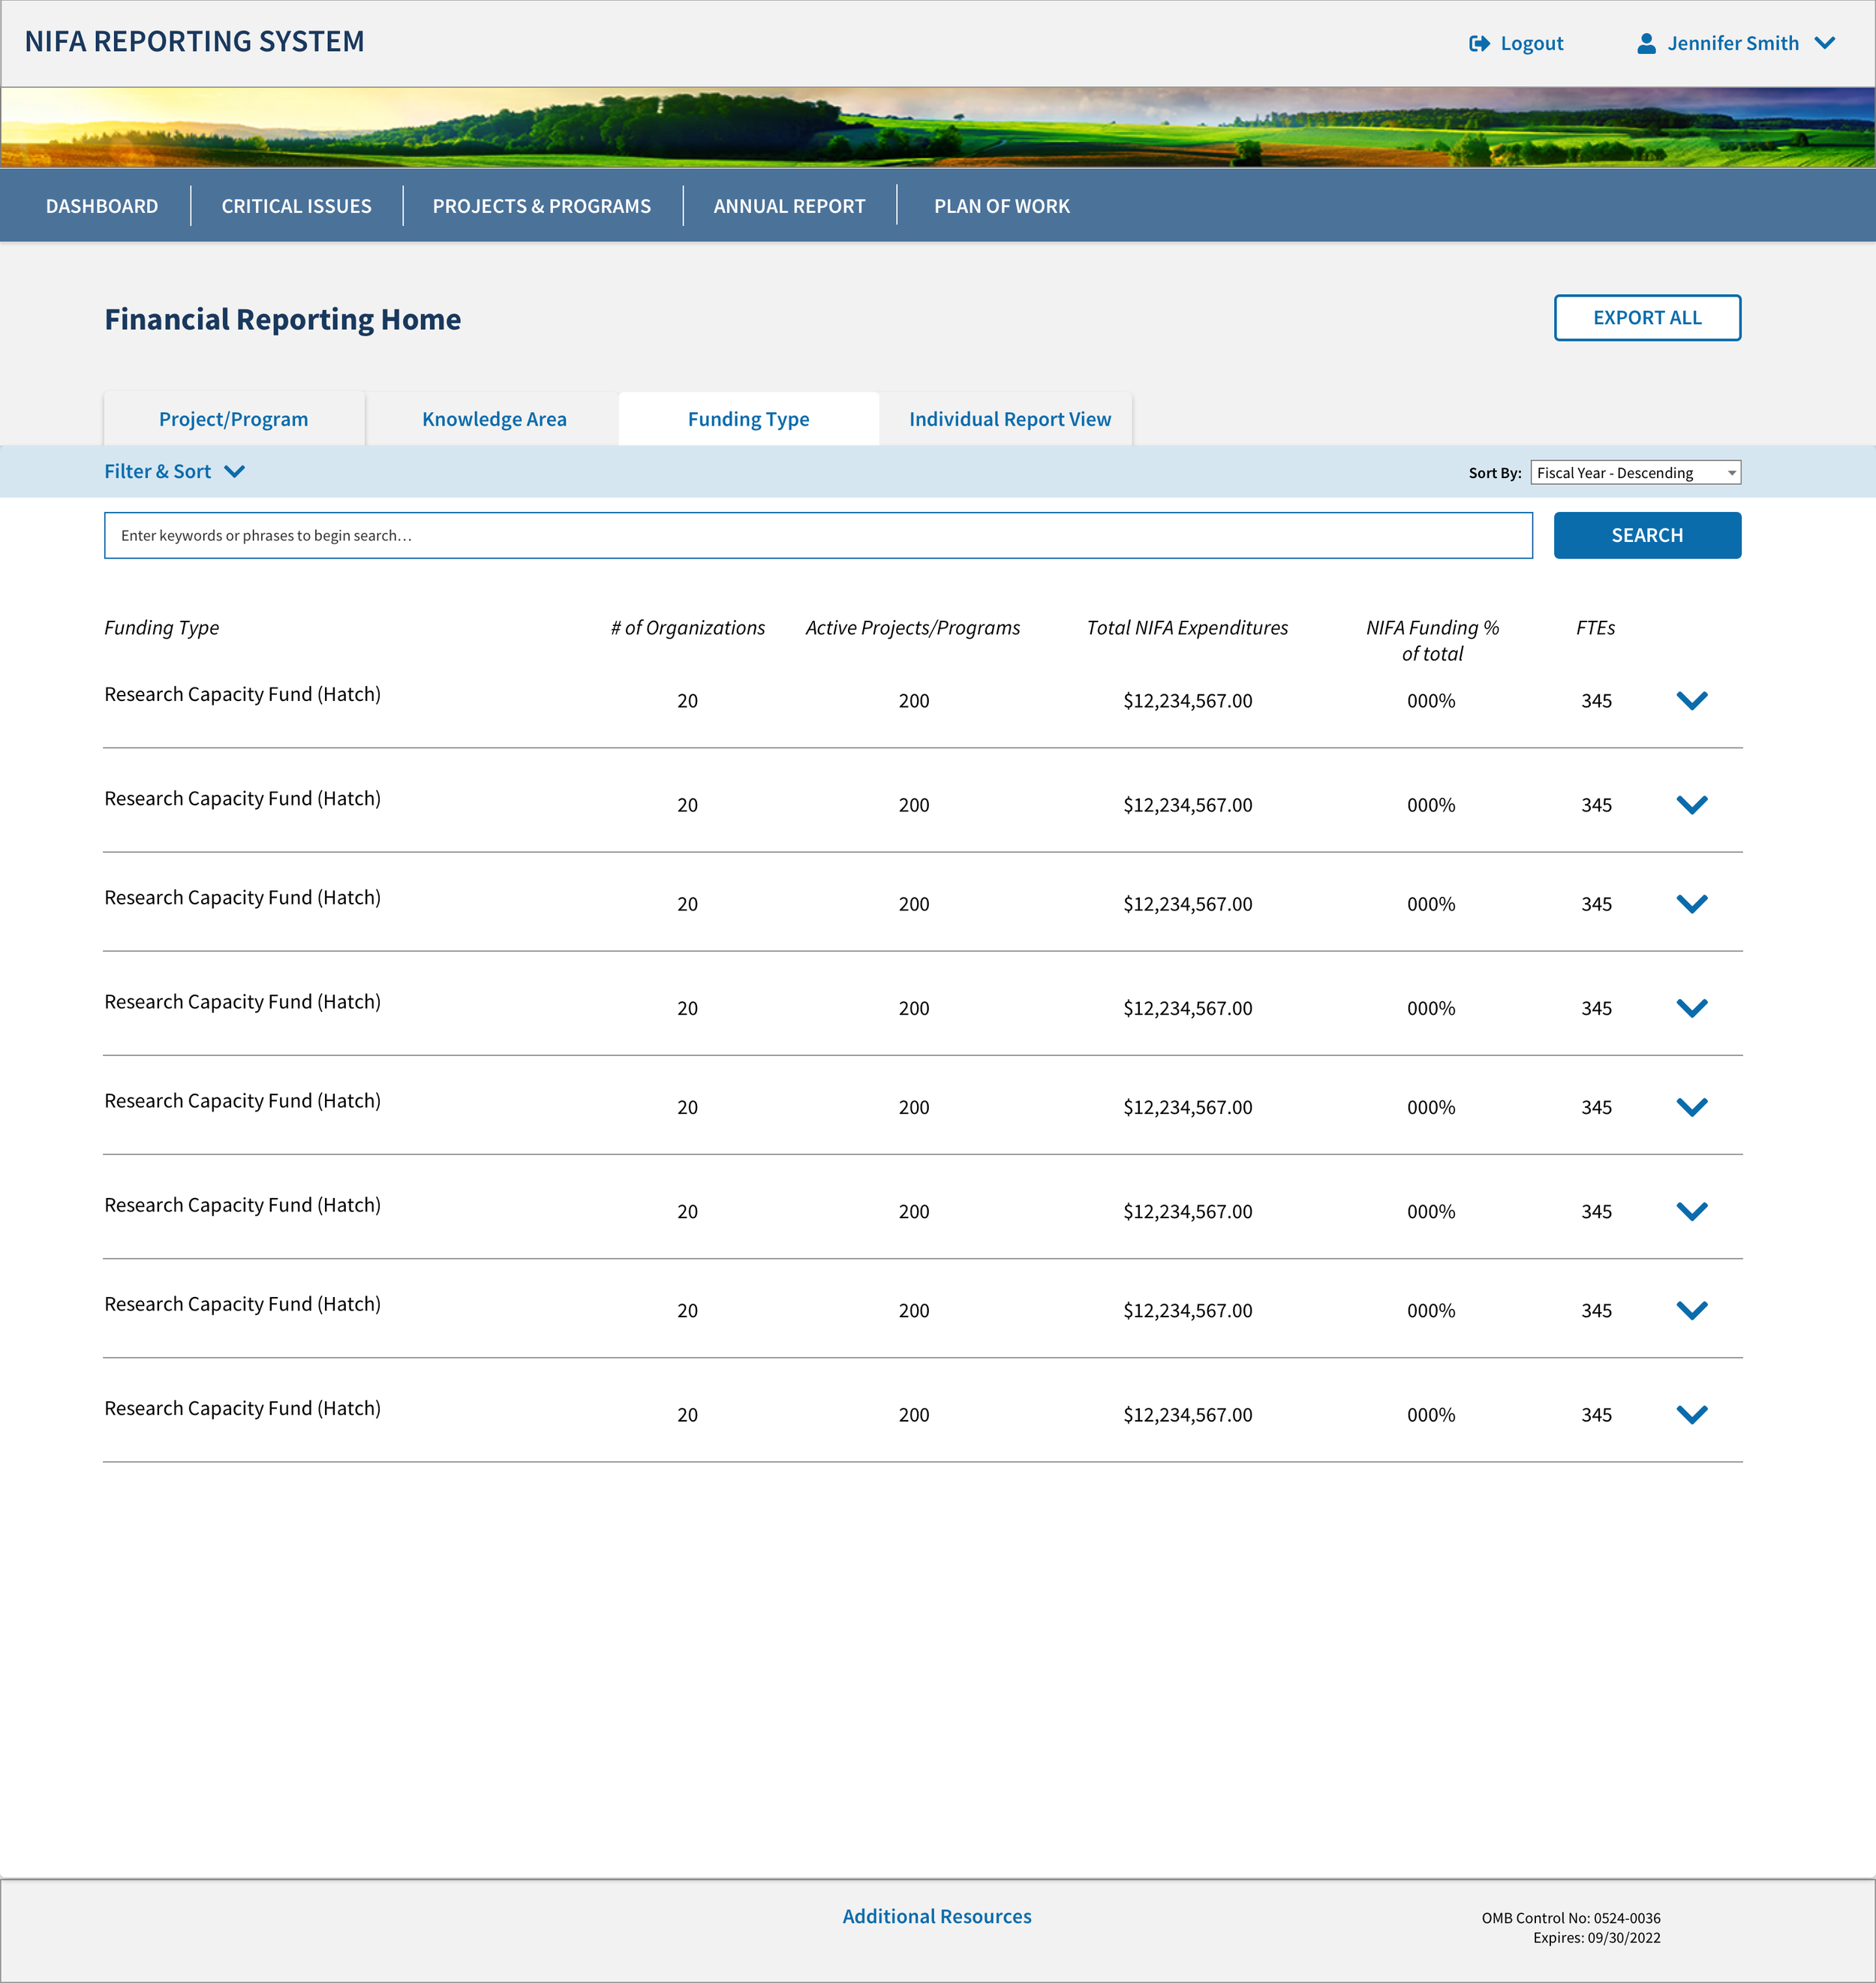
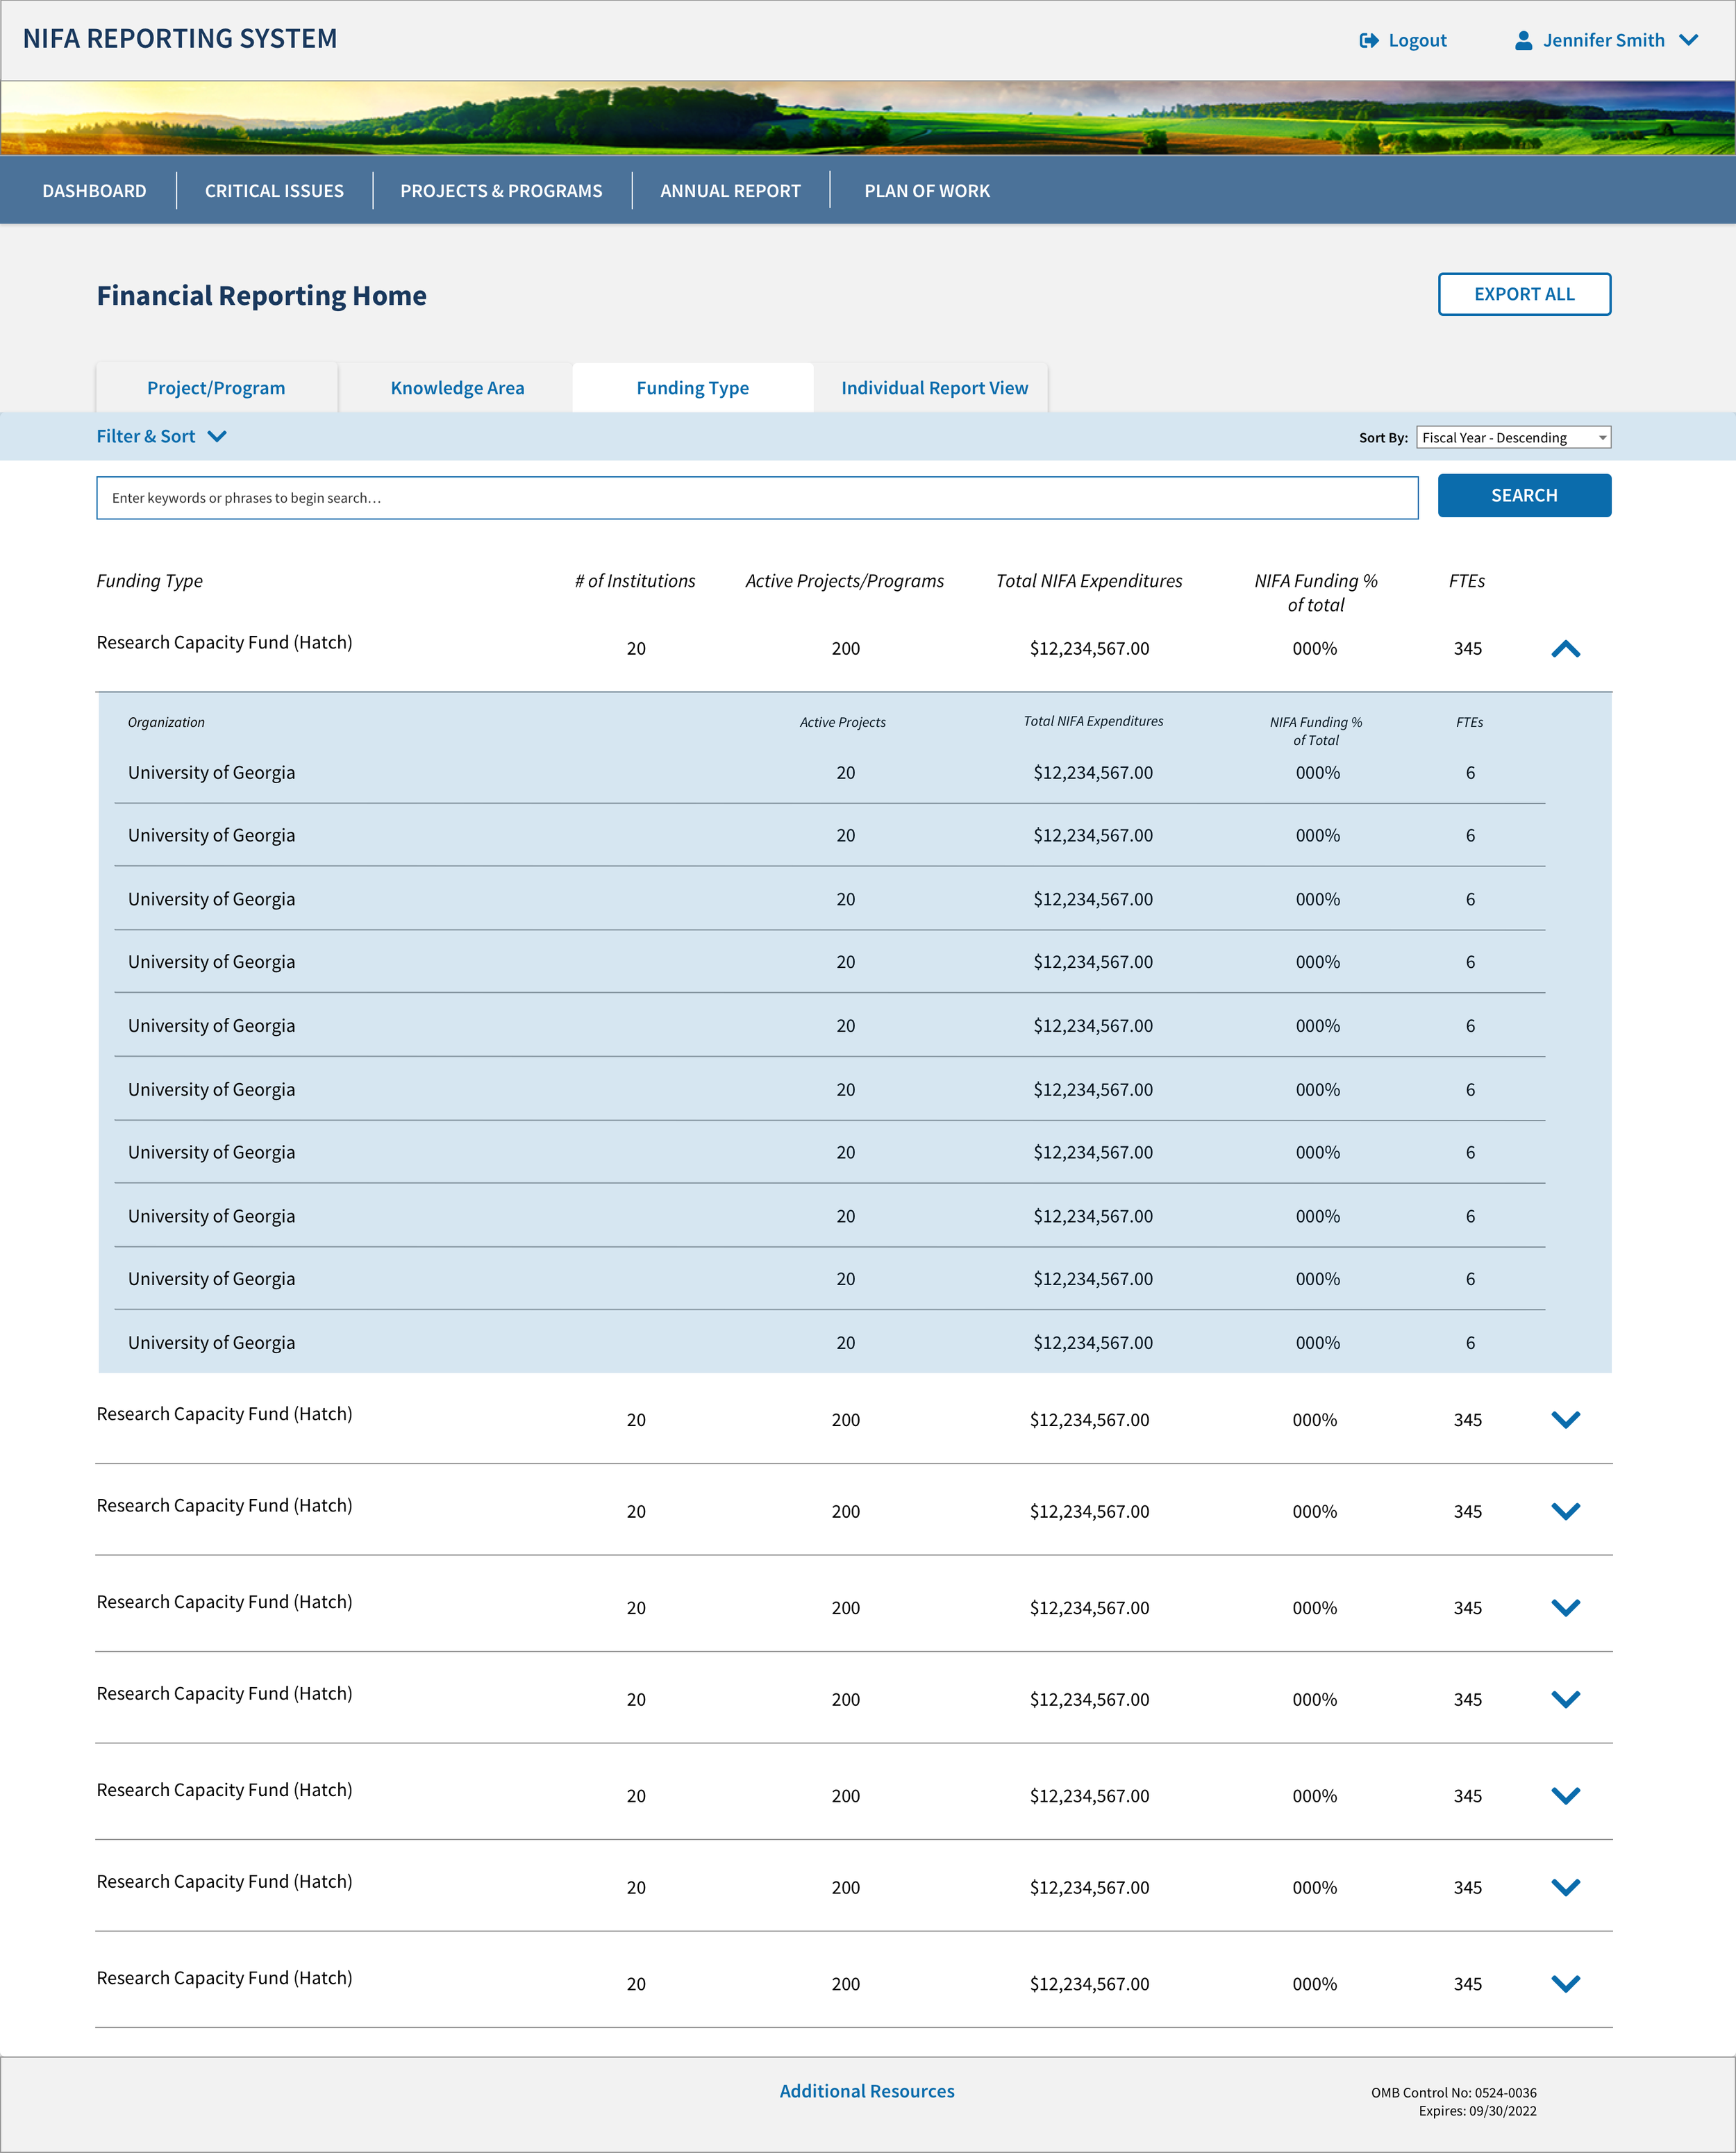
There are a set number of funding types associated with different funding sources. This section shows all of the universities organized by their funding source. This section allows NIFA employees to see how many projects and programs are associated with a particular funding type, how much NIFA expenditure goes to each funding source at each university, and how many full time employees (FTE) are being funded through each funding source.
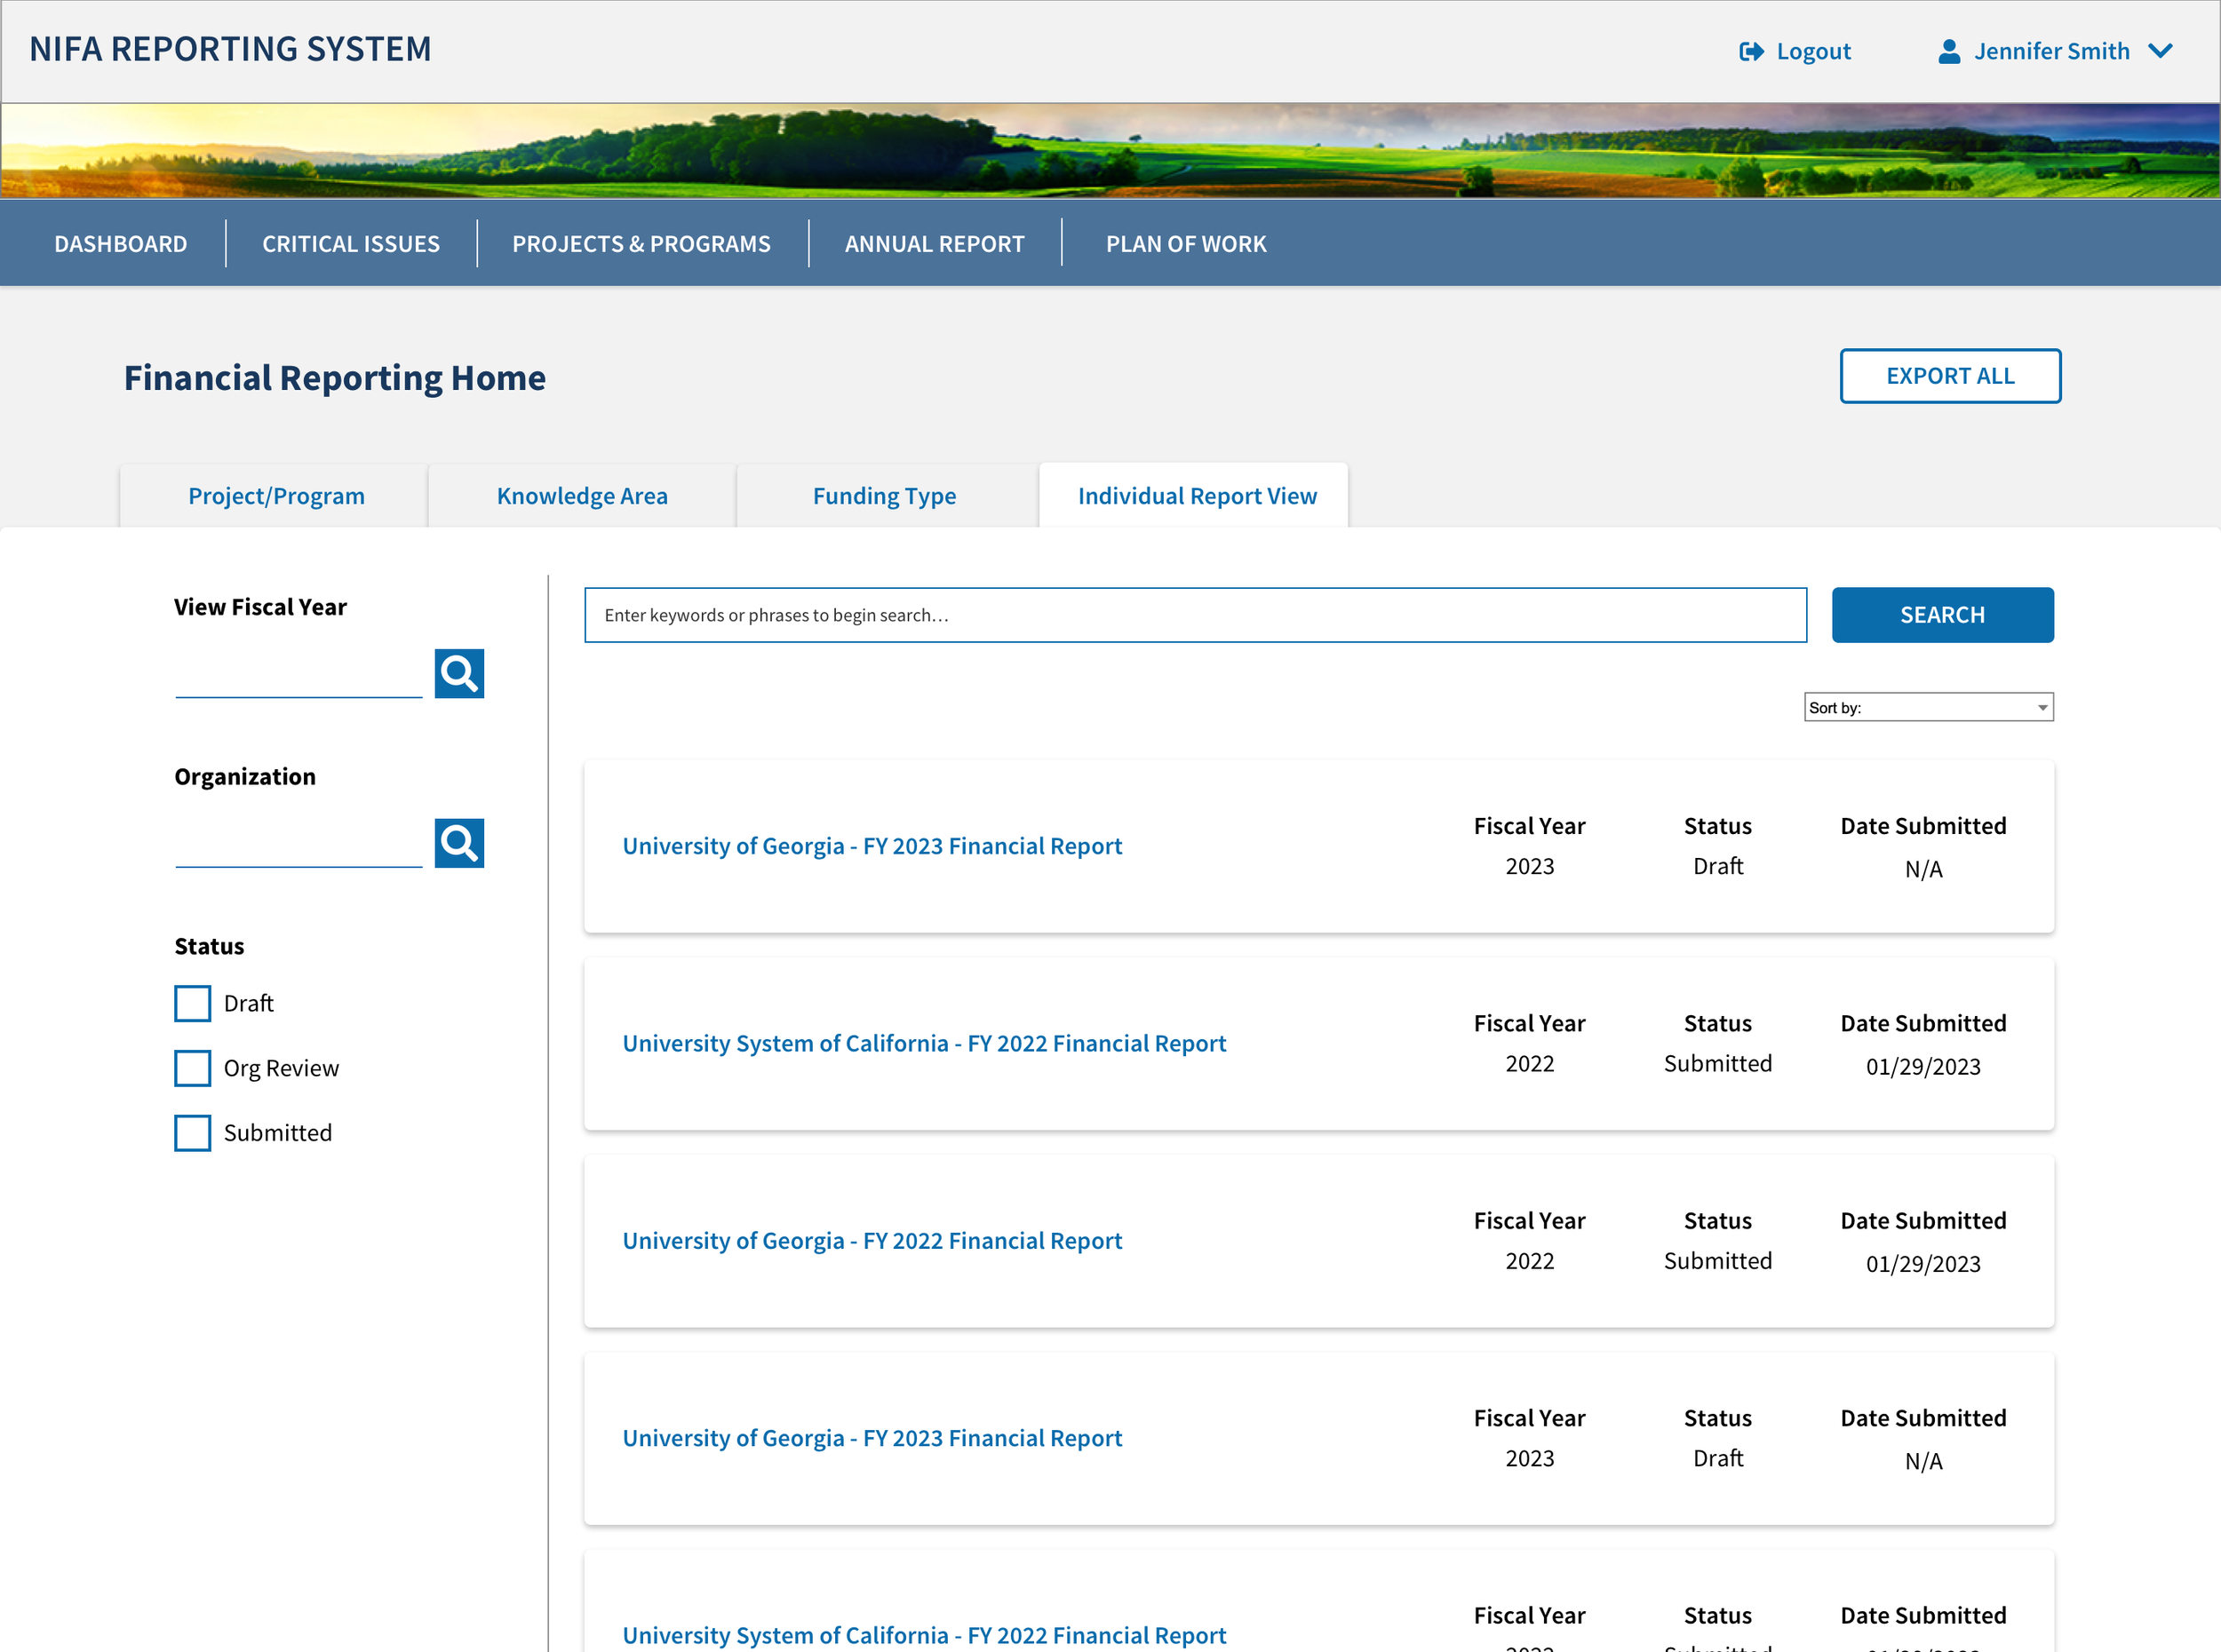
The last tab shows every financial report for every university by individual report.
Financial Module (University Side)
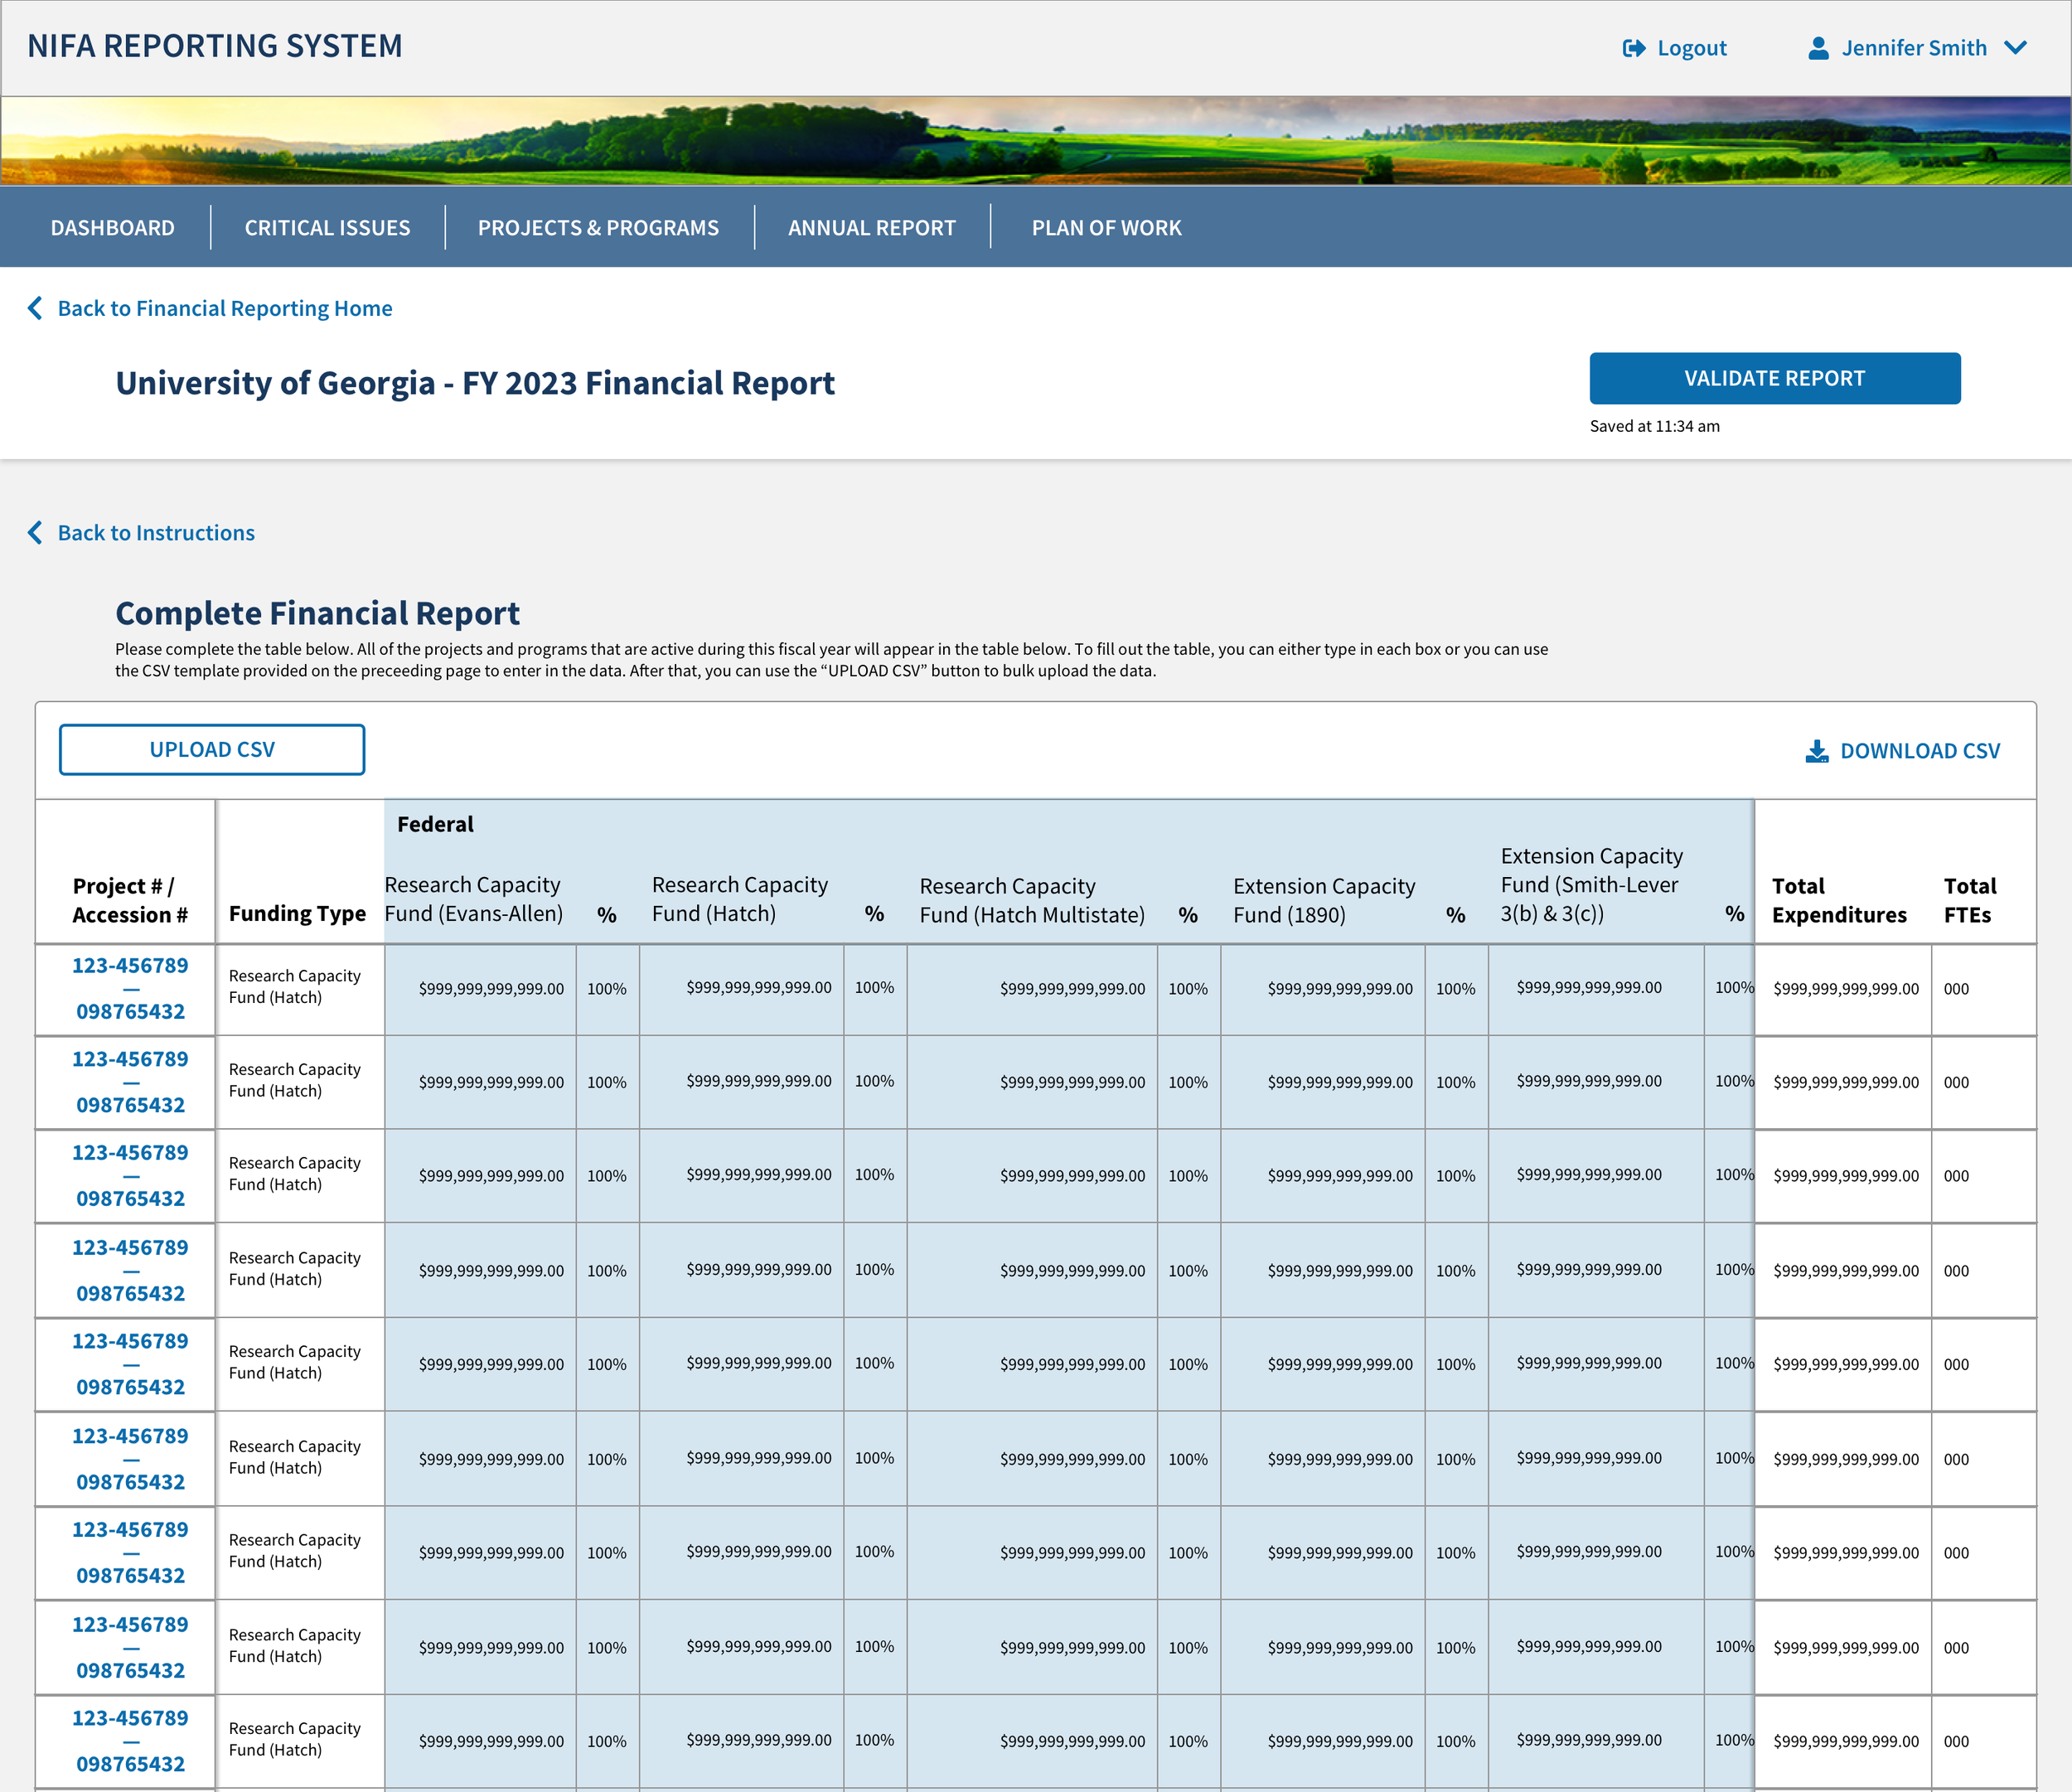
For the University side of things, all the user needs to do is to upload a csv file (exported from their financial systems) to the Financial reporting module within NRS. The user can also enter the information in manually if they desire. Once uploaded, the user selects the “Validate Report” button to continue.
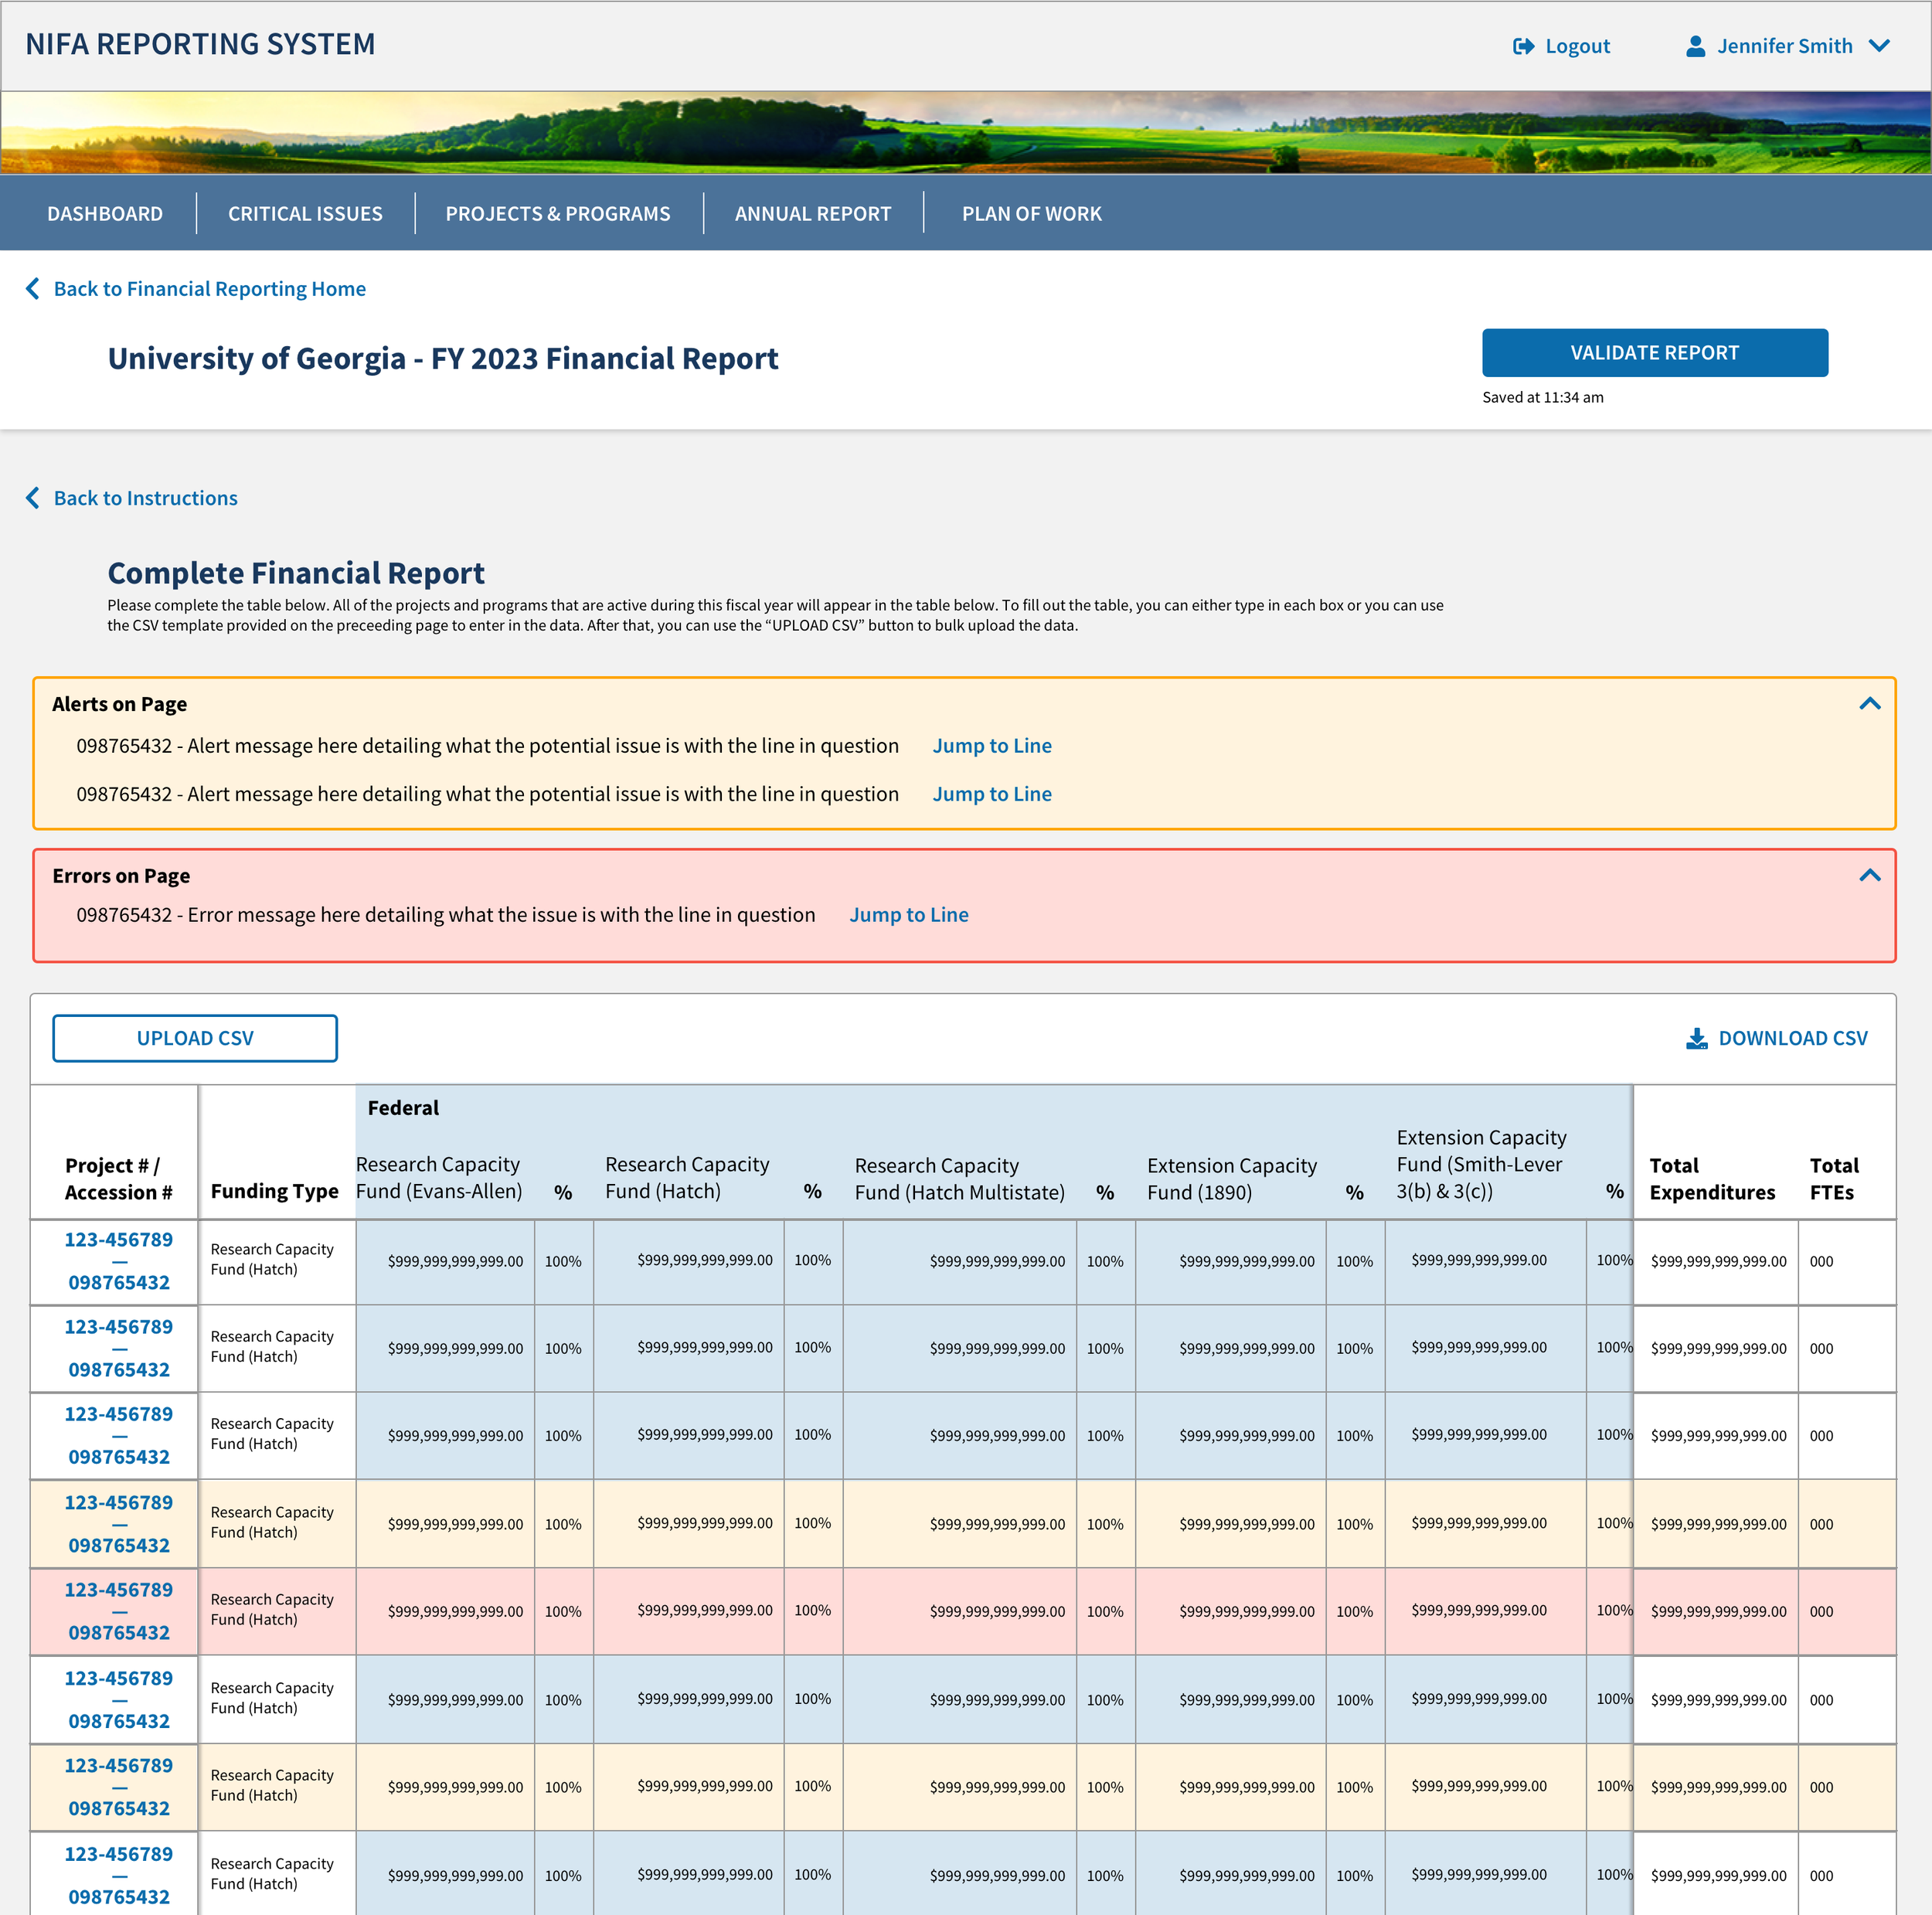
The NRS Financial Module checks any errors within the uploaded or entered report. The error messages at the top of the page are divided into two types. Alerts, which are flags on a report, but the report can still be submitted to NIFA, and Errors, which are flags on a report that must be resolved before the report can be submitted to NIFA.
Much like the Plan of Work and Annual Report experiences, the user is then given an option to review their report before officially submitting to NIFA.
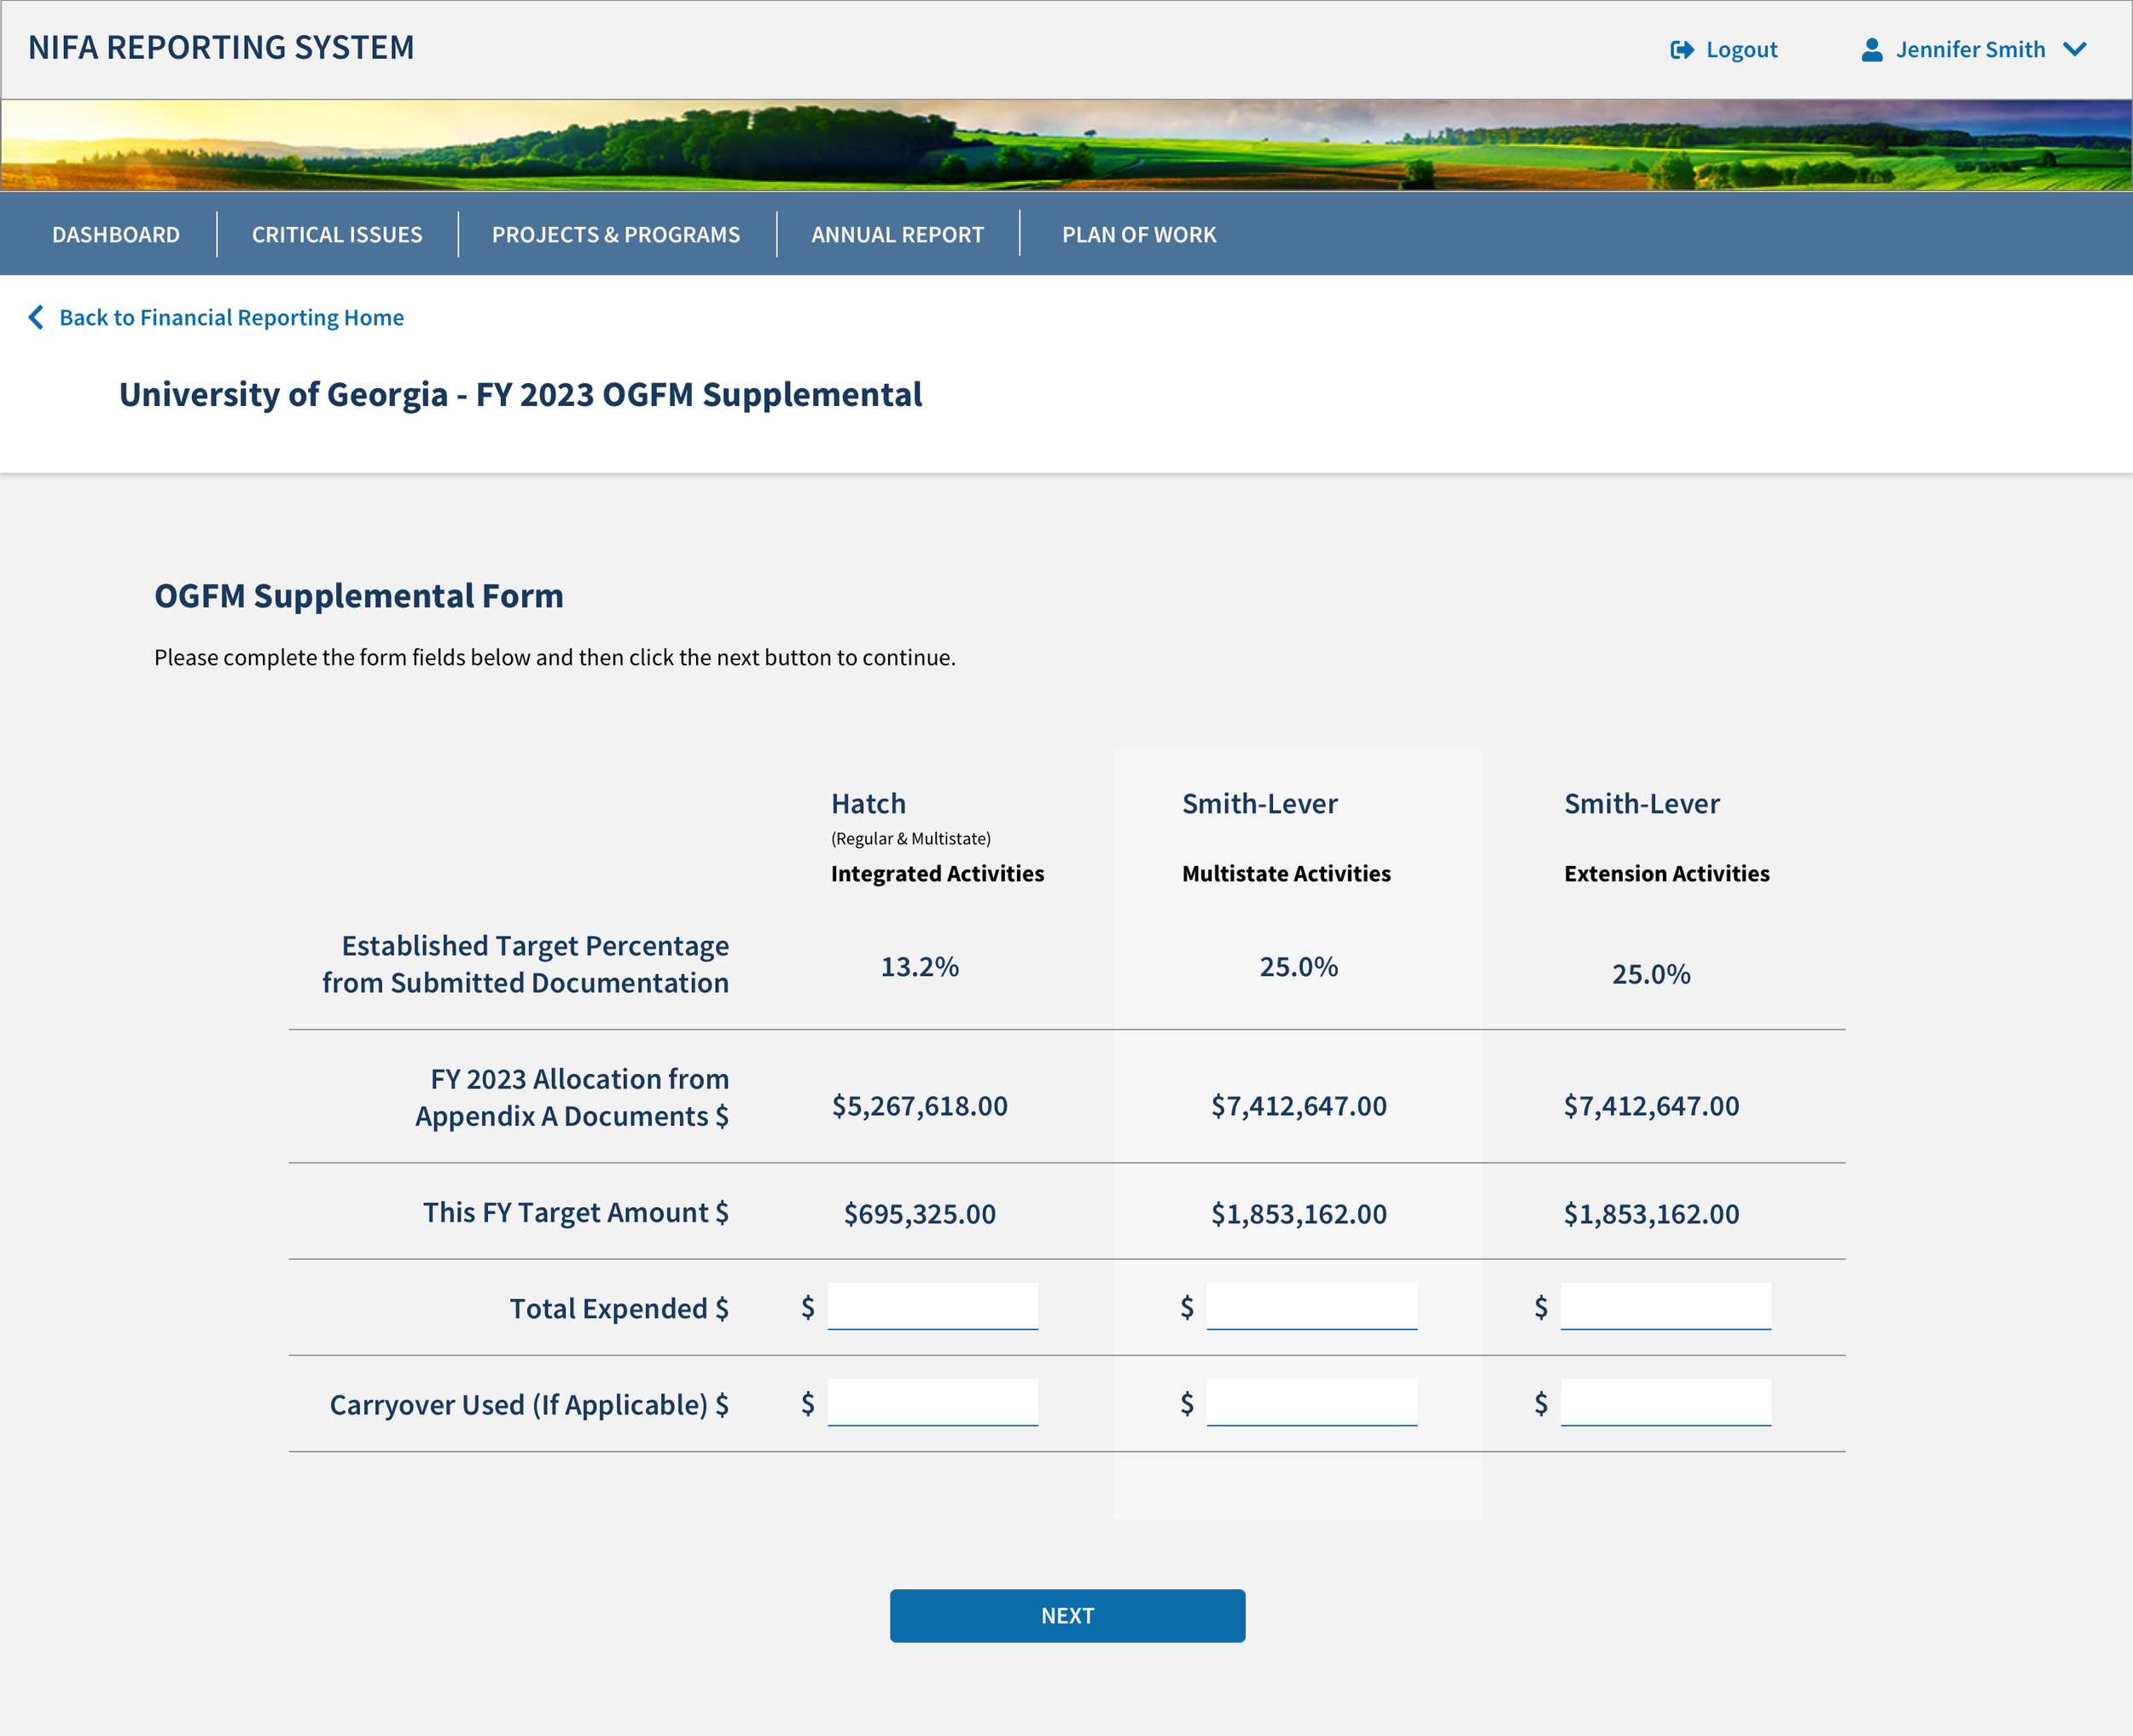
OGFM Supplemental Report Experience
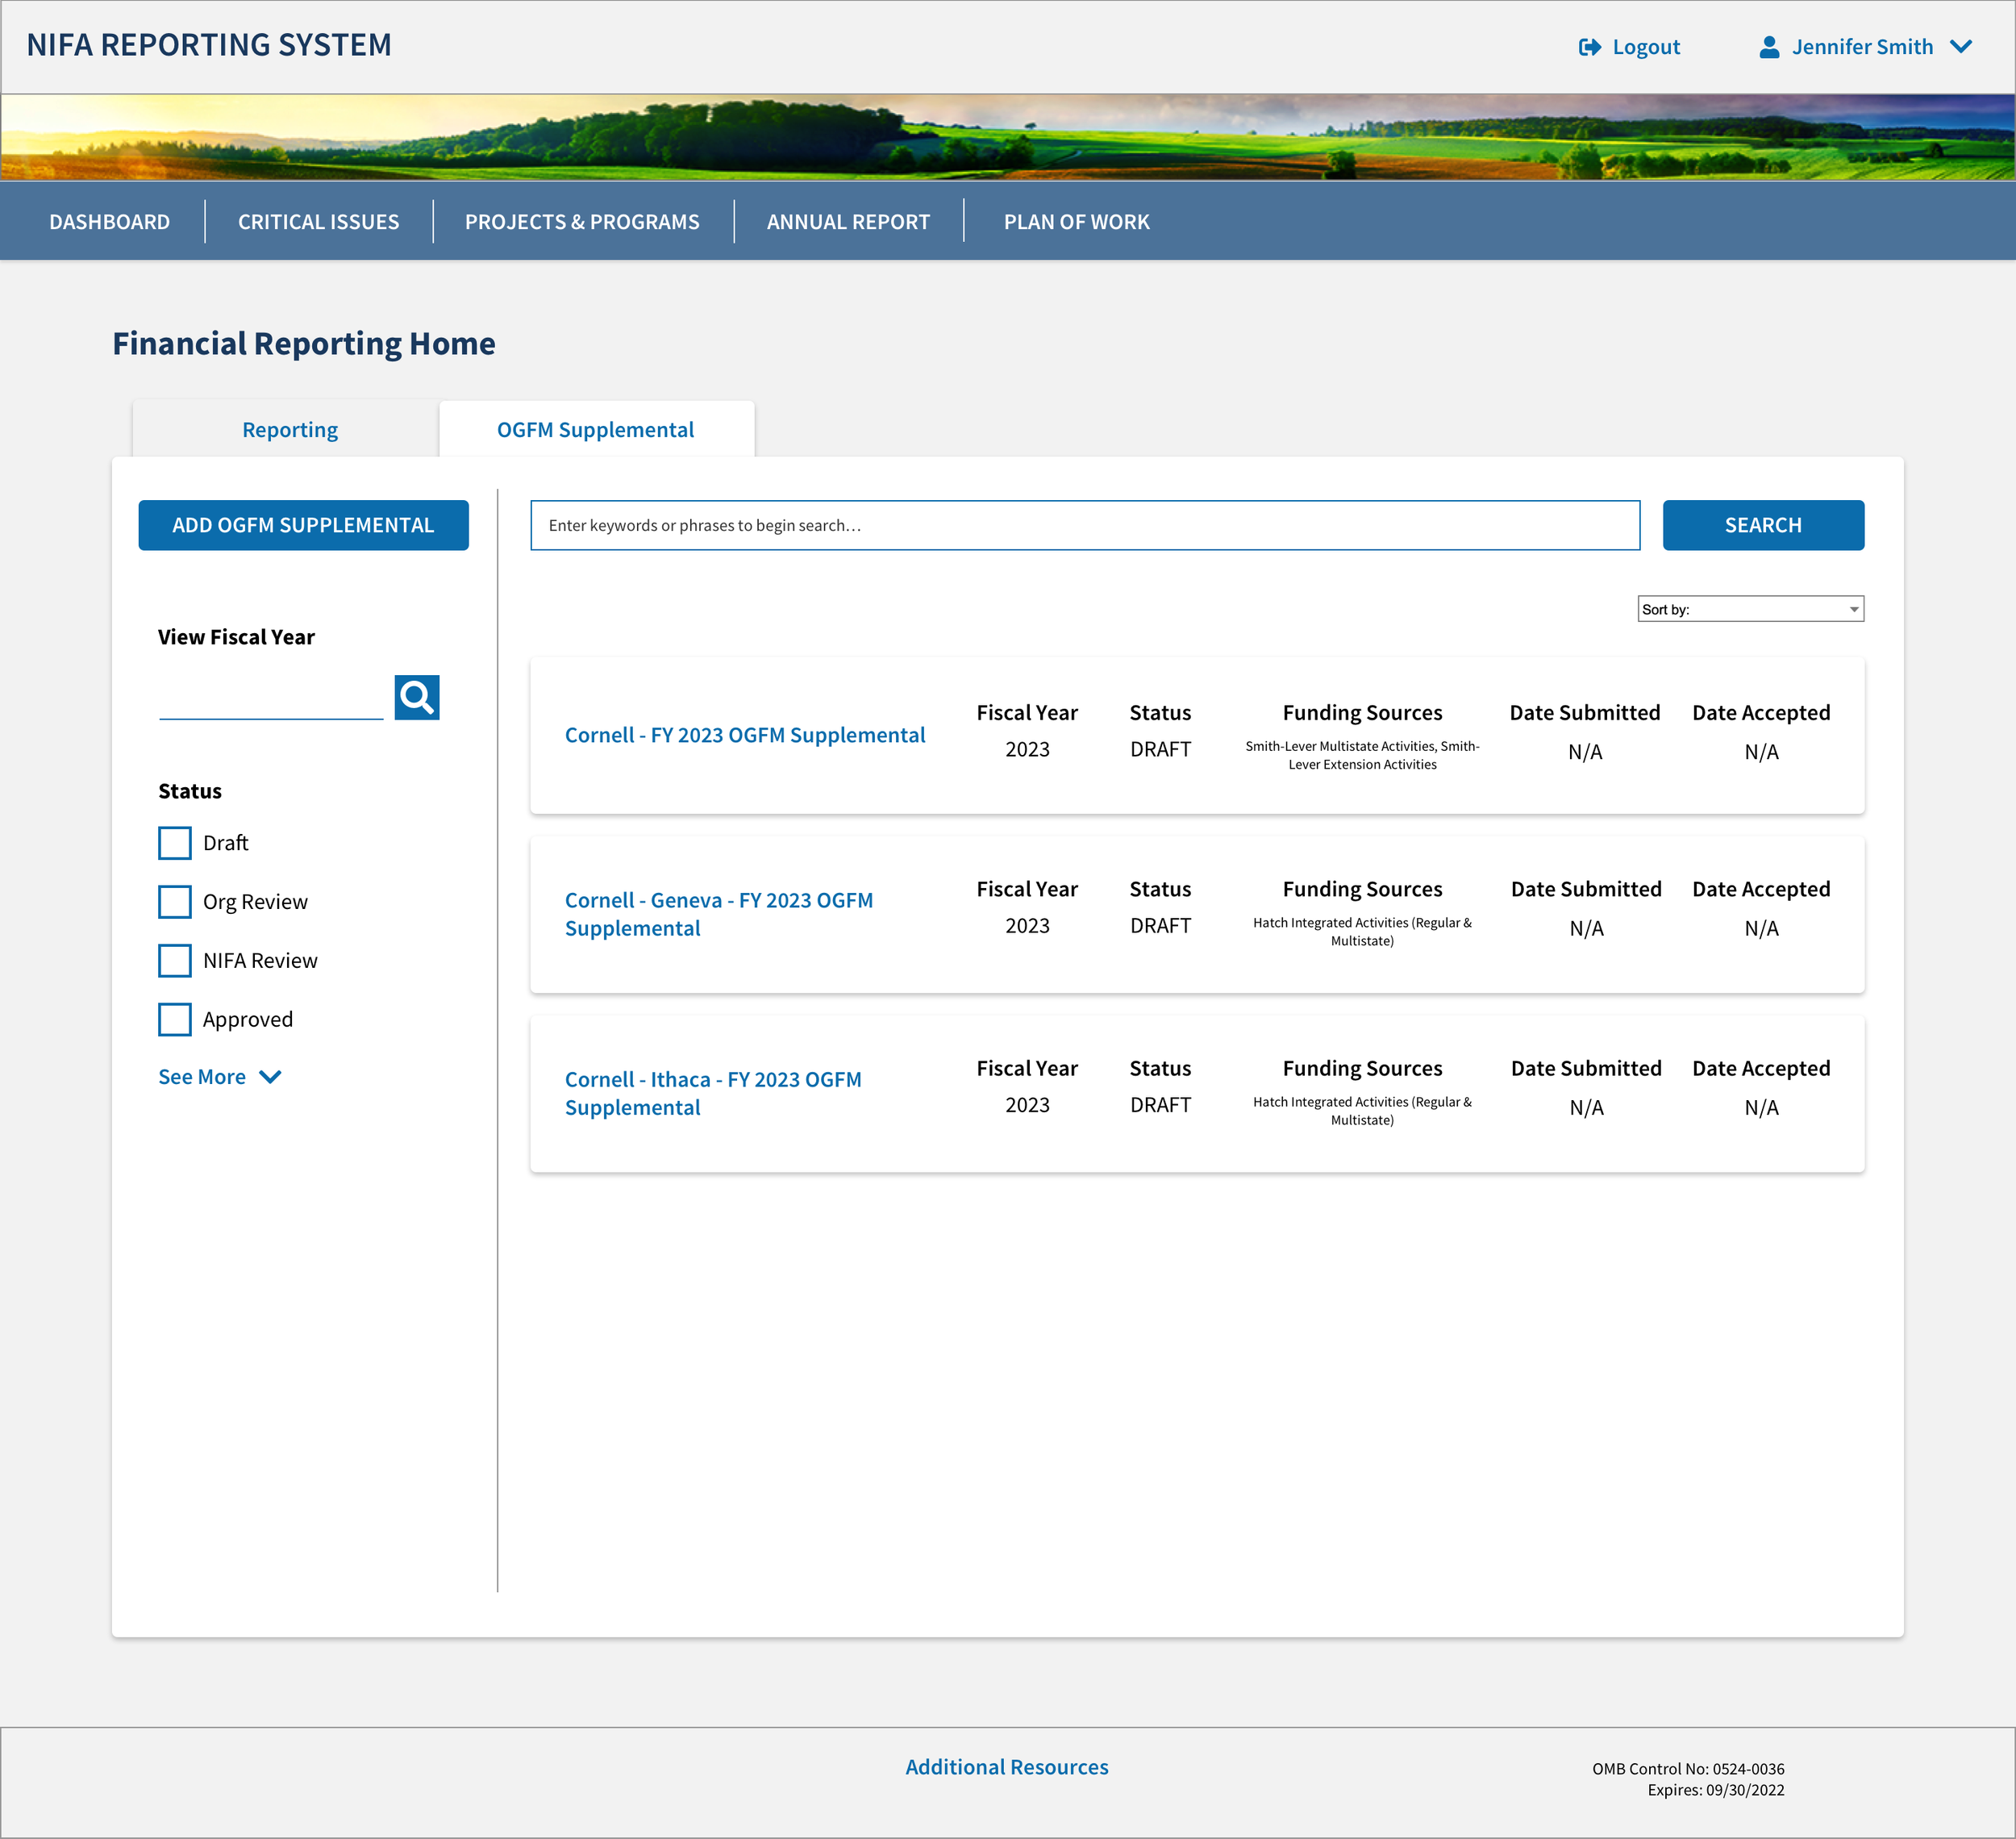
The OGFM Supplemental is an additional form that only a set number of universities have to fill out. This form is filed alongside a University’s Financial Report.
Instead of making a separate experience within NRS, we combined the OGFM Supplemental experience into the same page as the Financial Reporting module, just in a new tab.
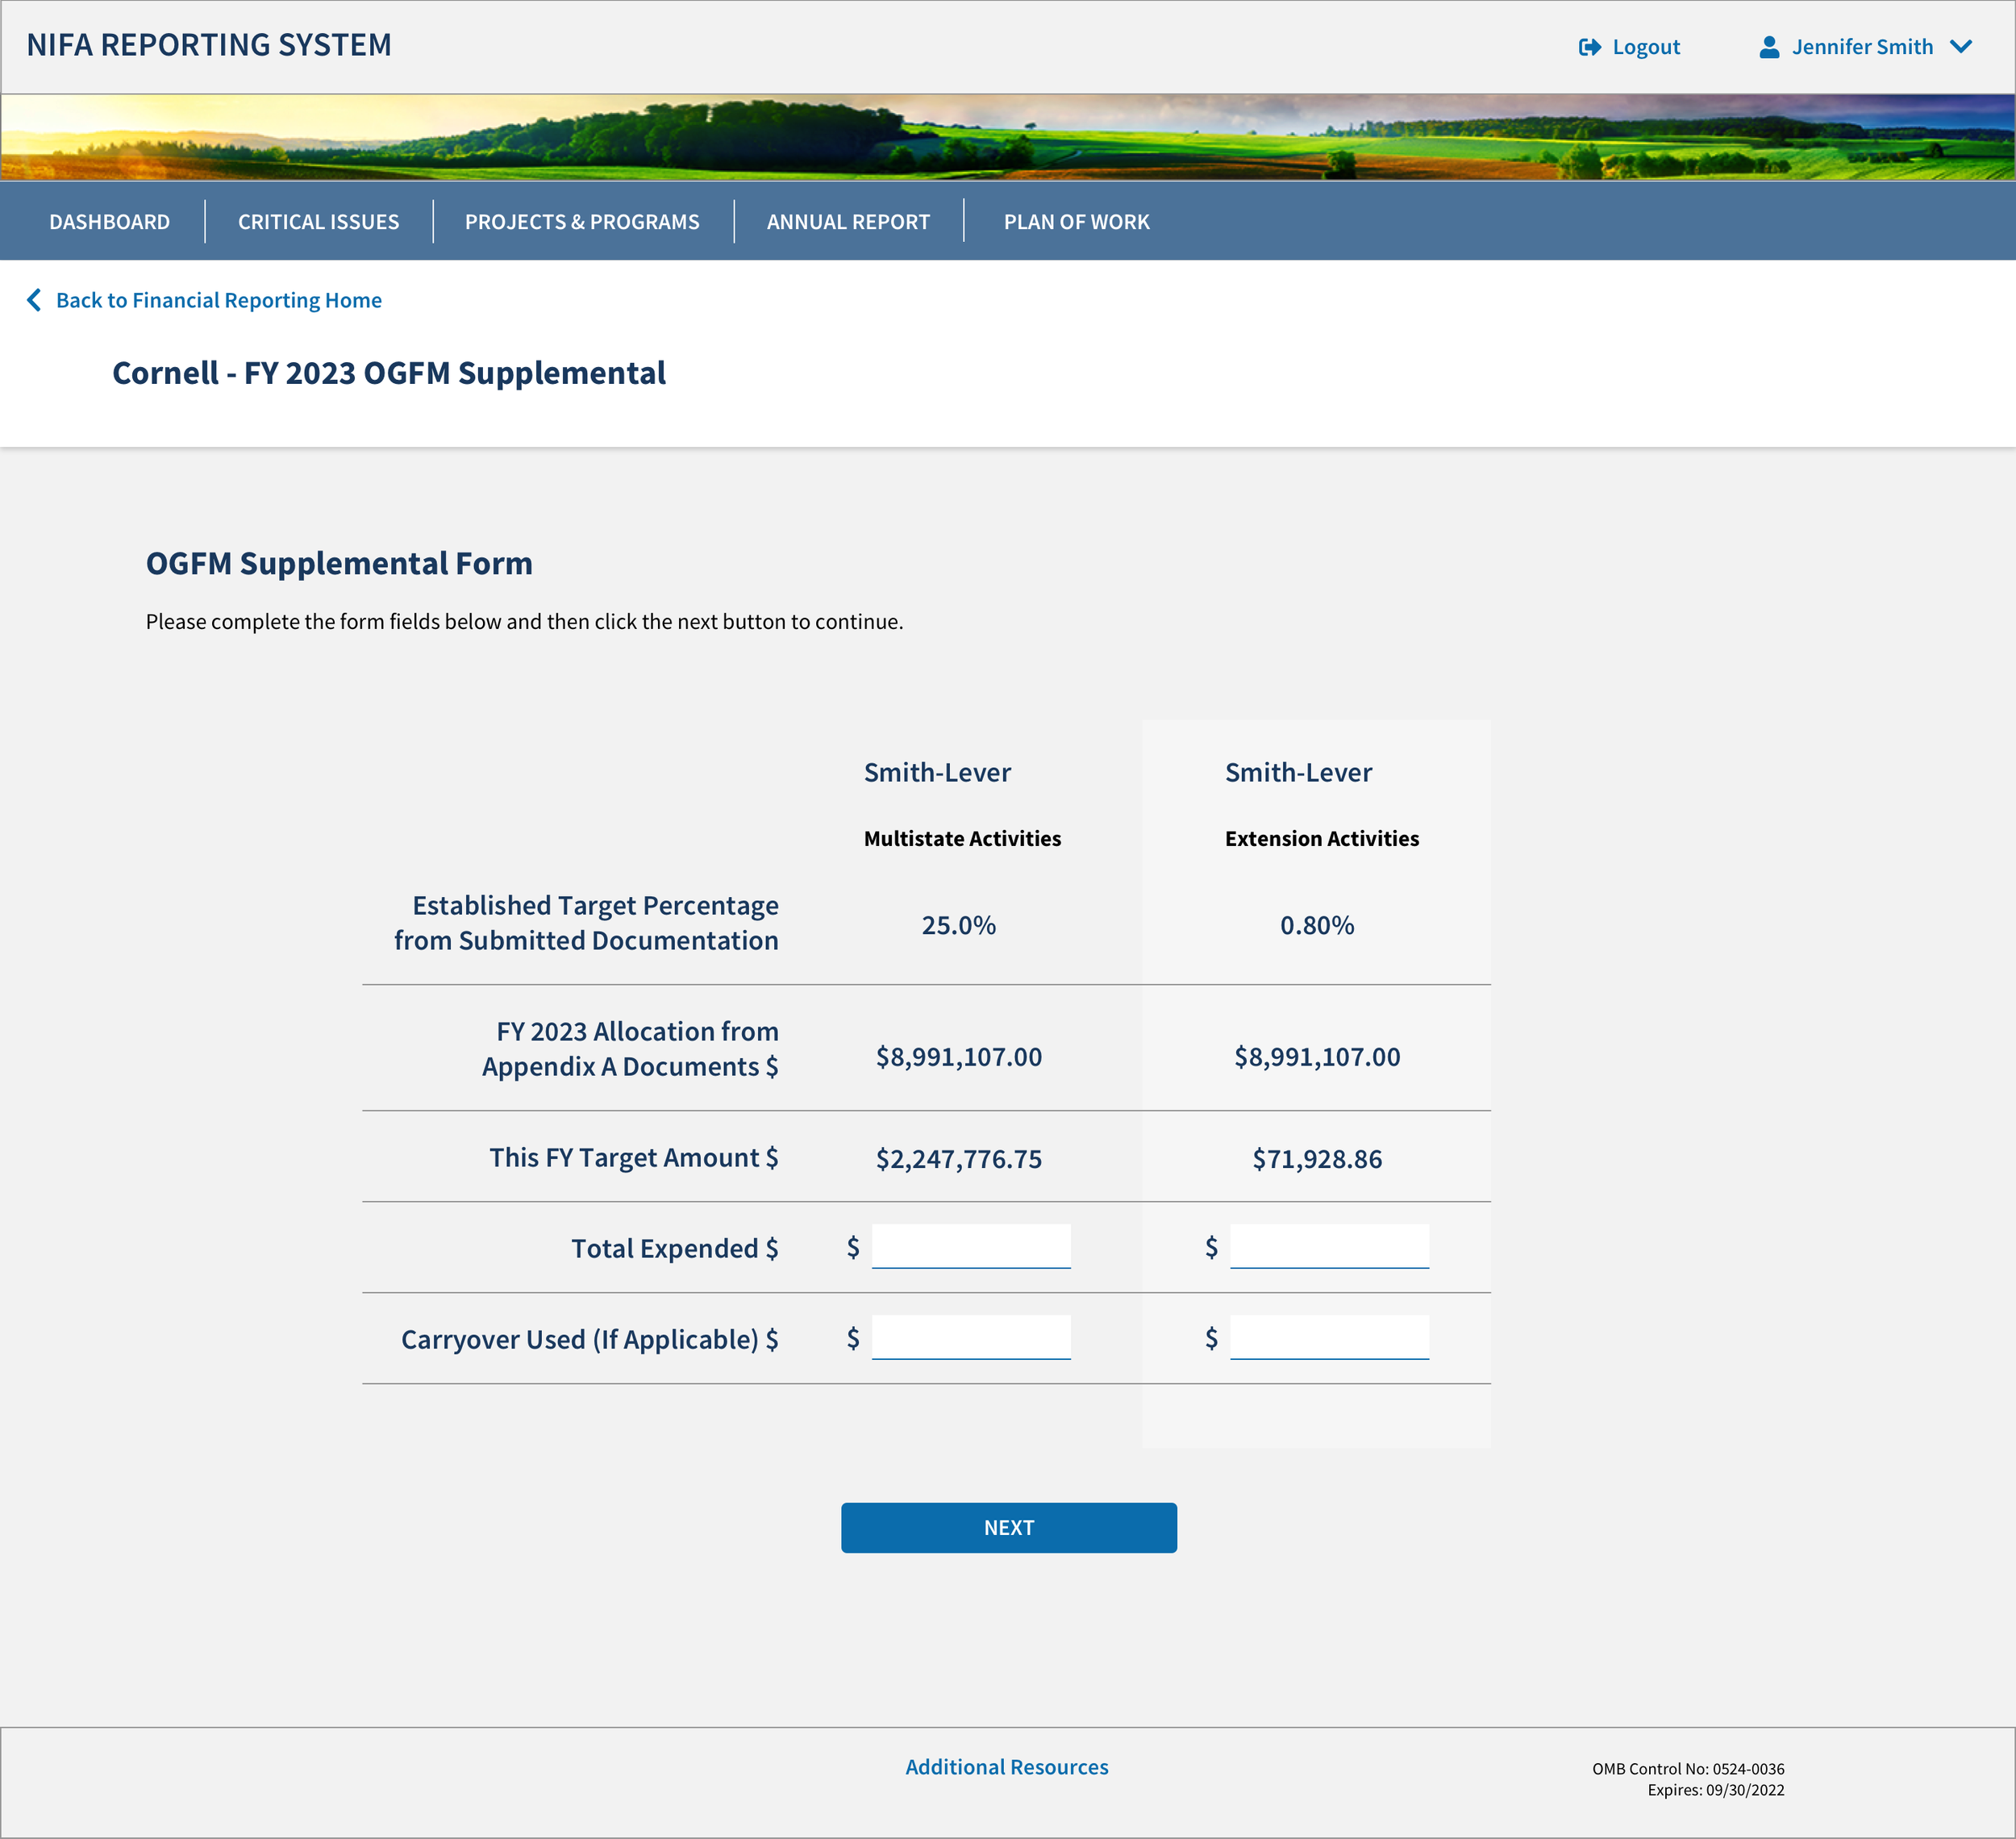
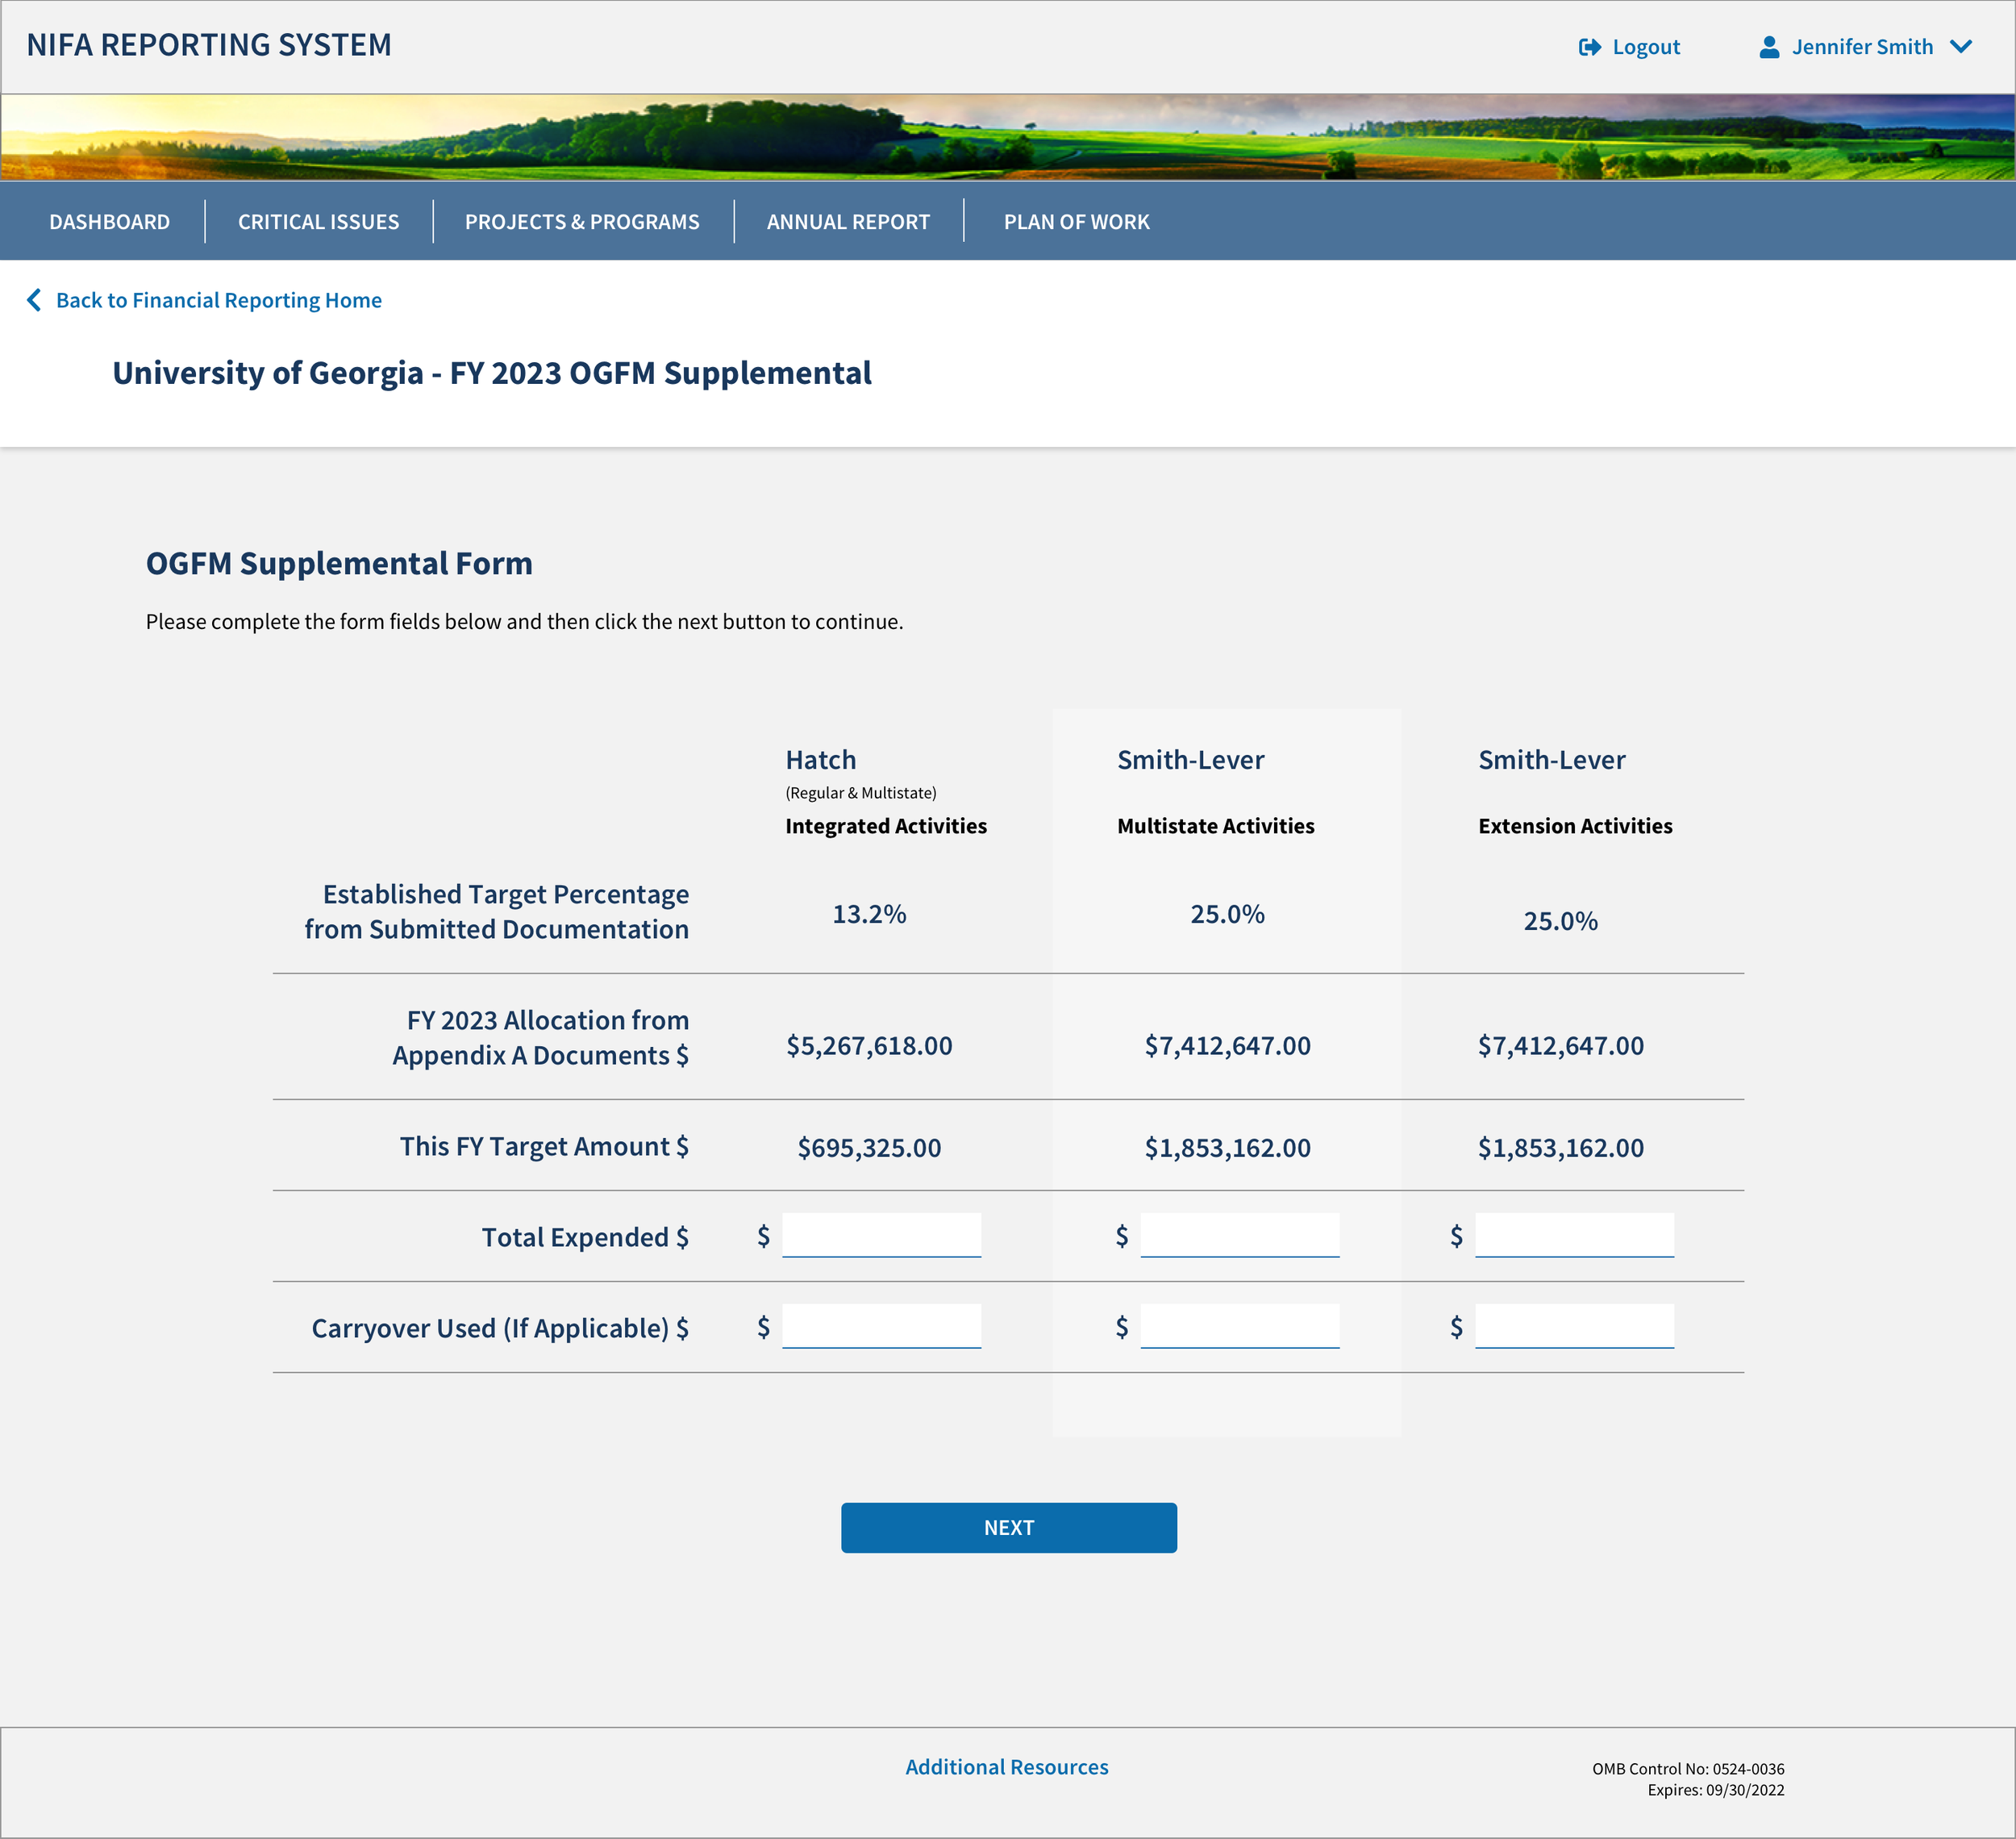
When a university creates a new report, the system automatically recognizes which funding sources that a university needs to make a report on and populates the relevant columns.
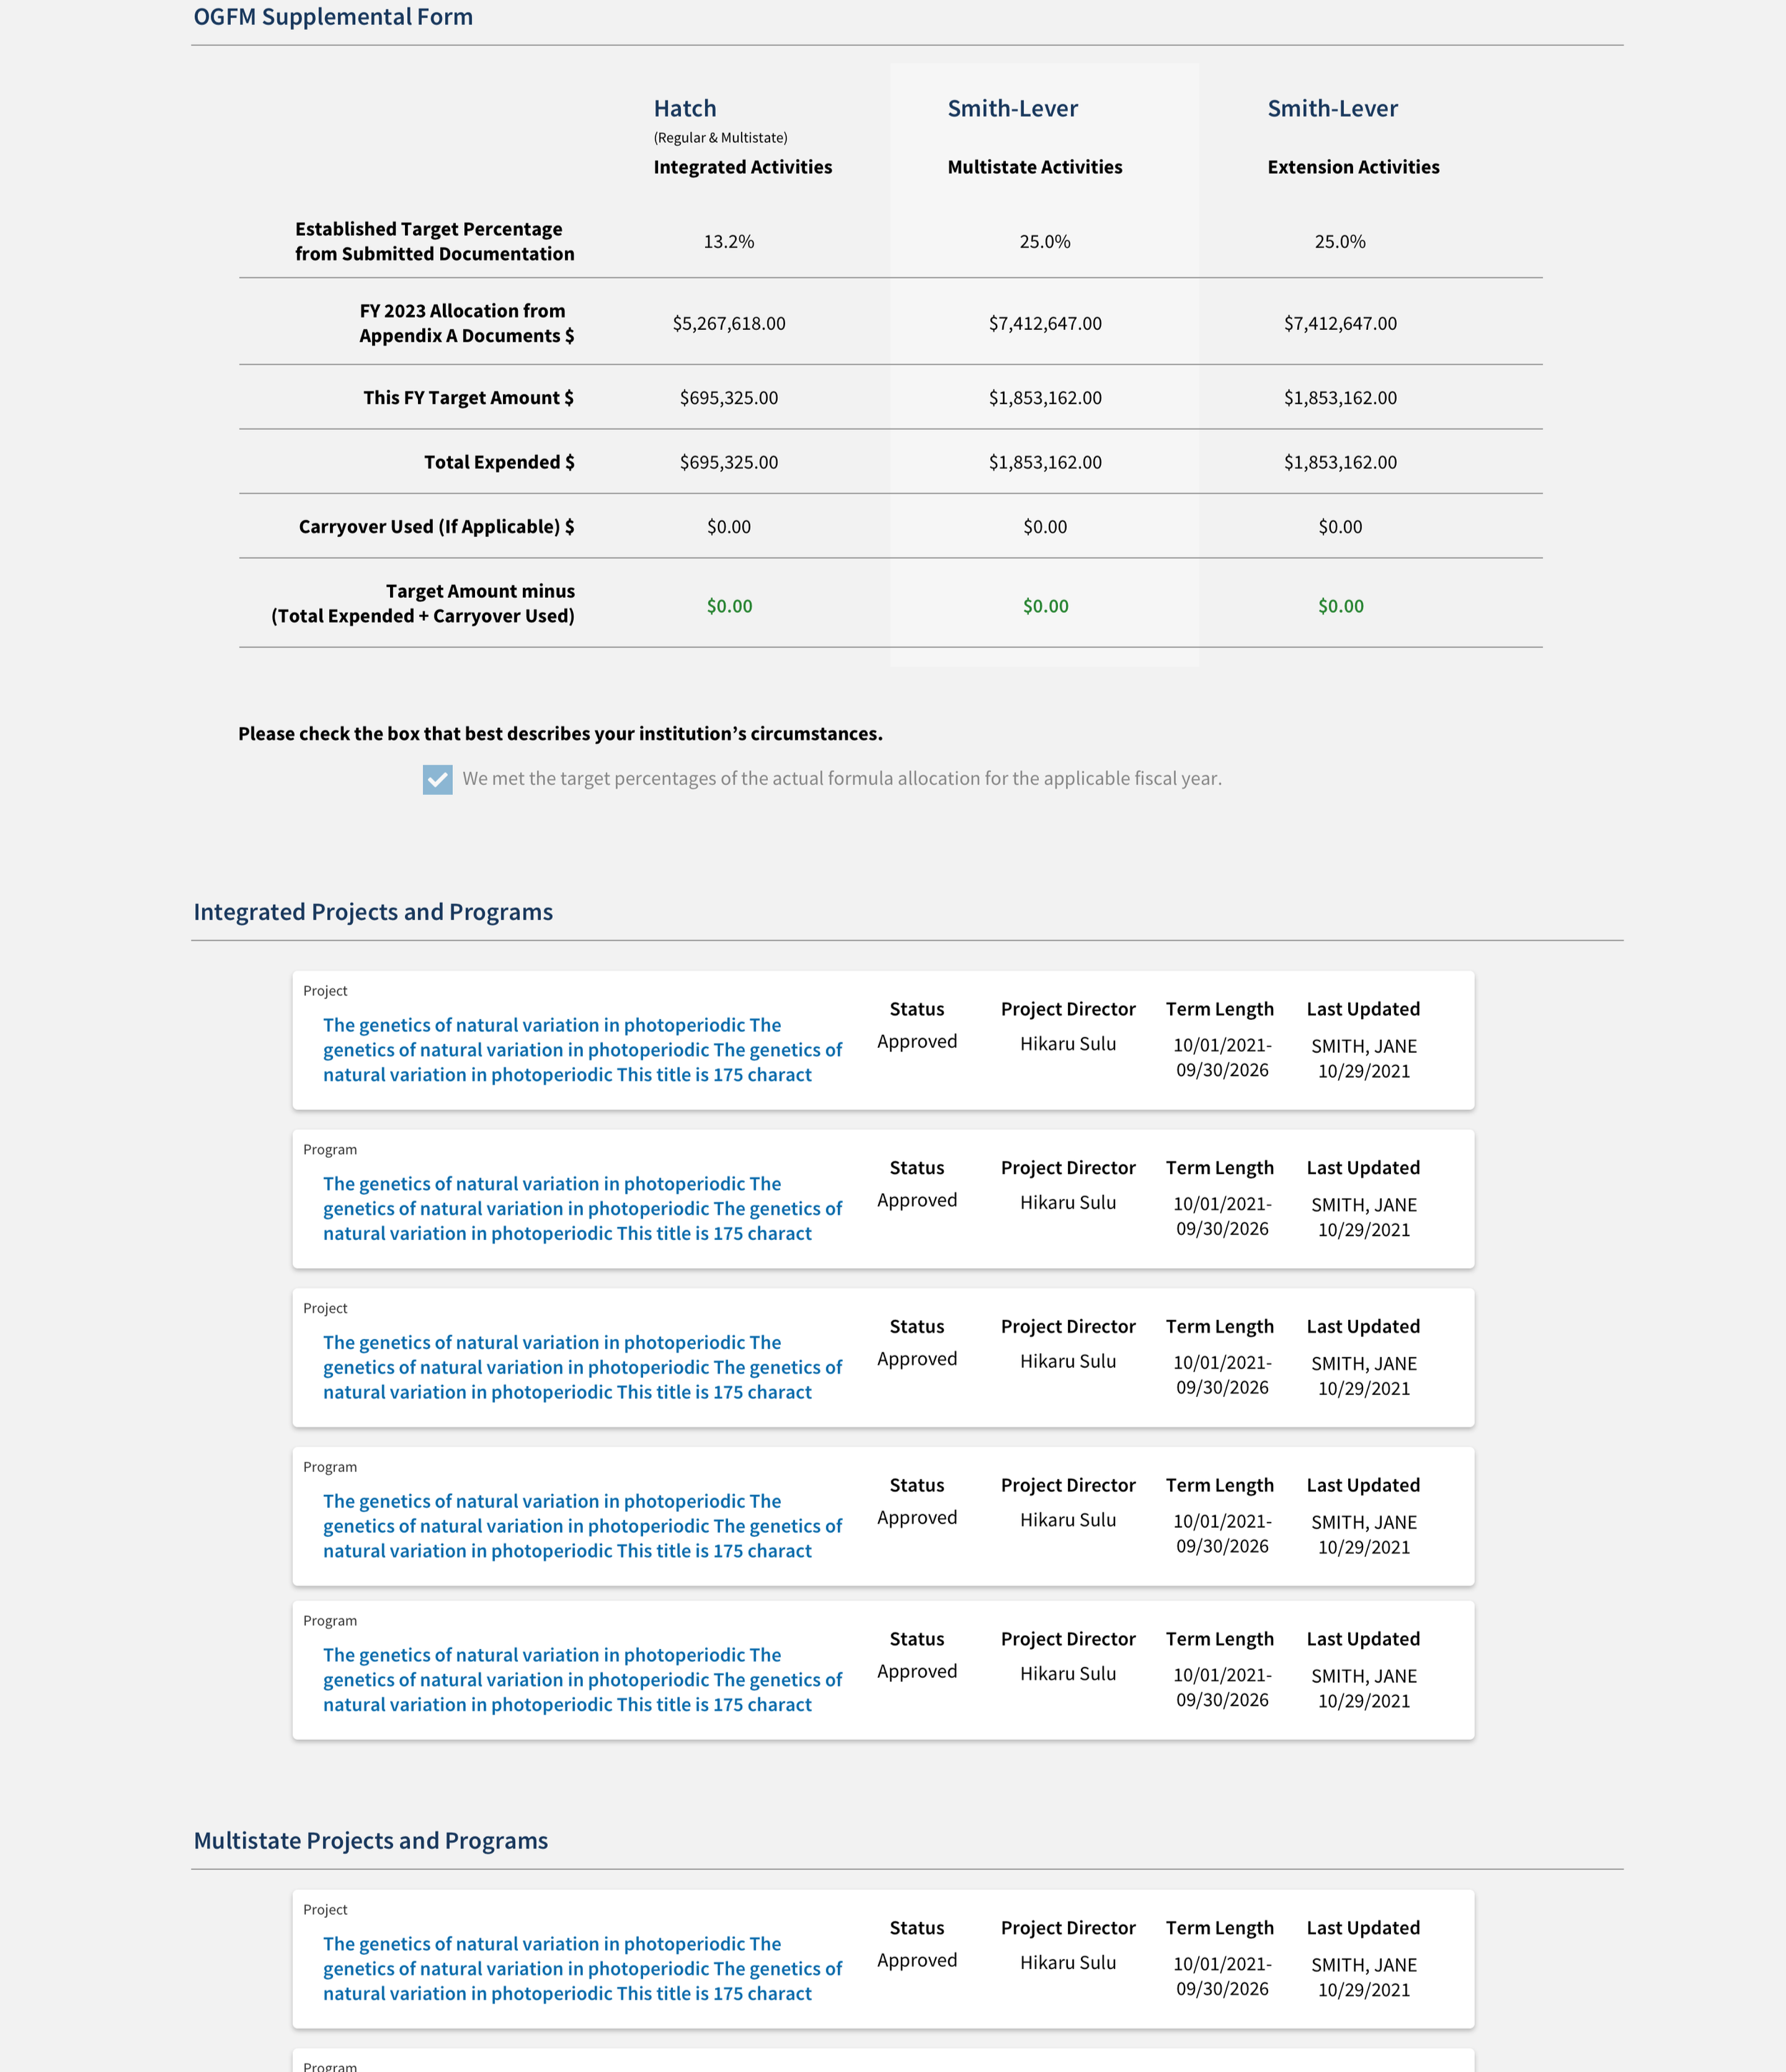
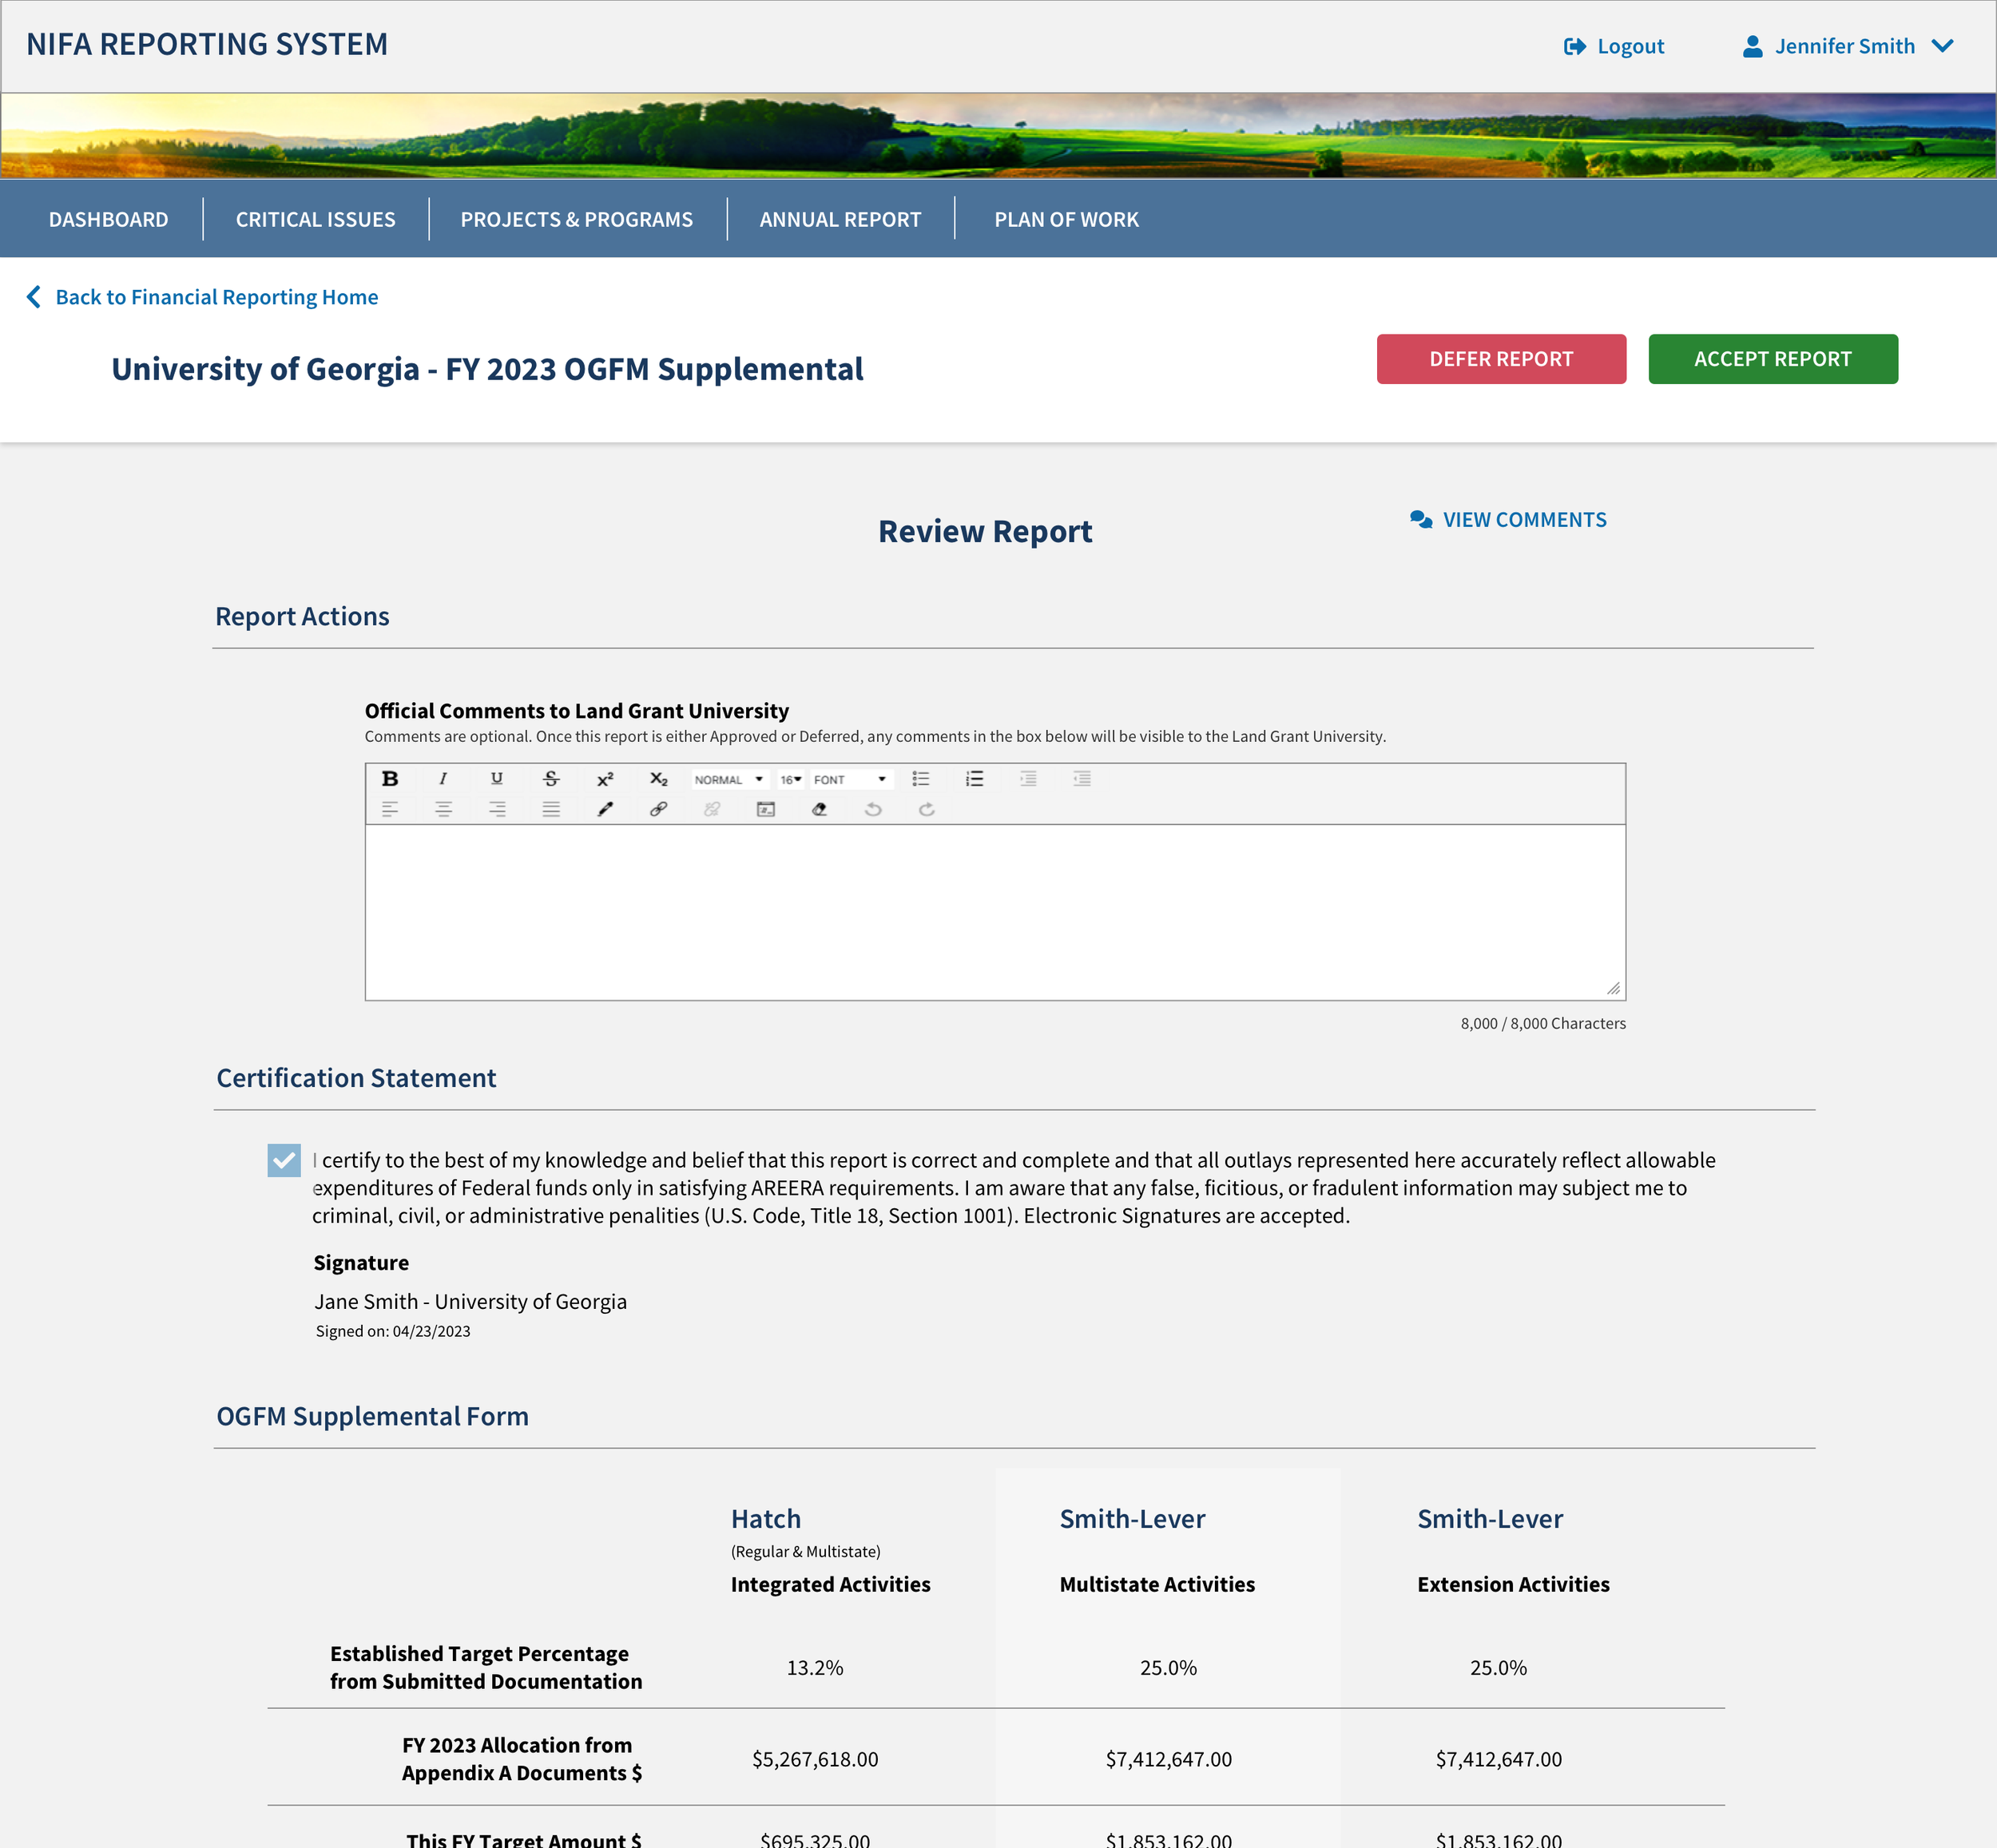
The module gives the user the opportunity to review the report and make relevant certification statements before they submit the report.
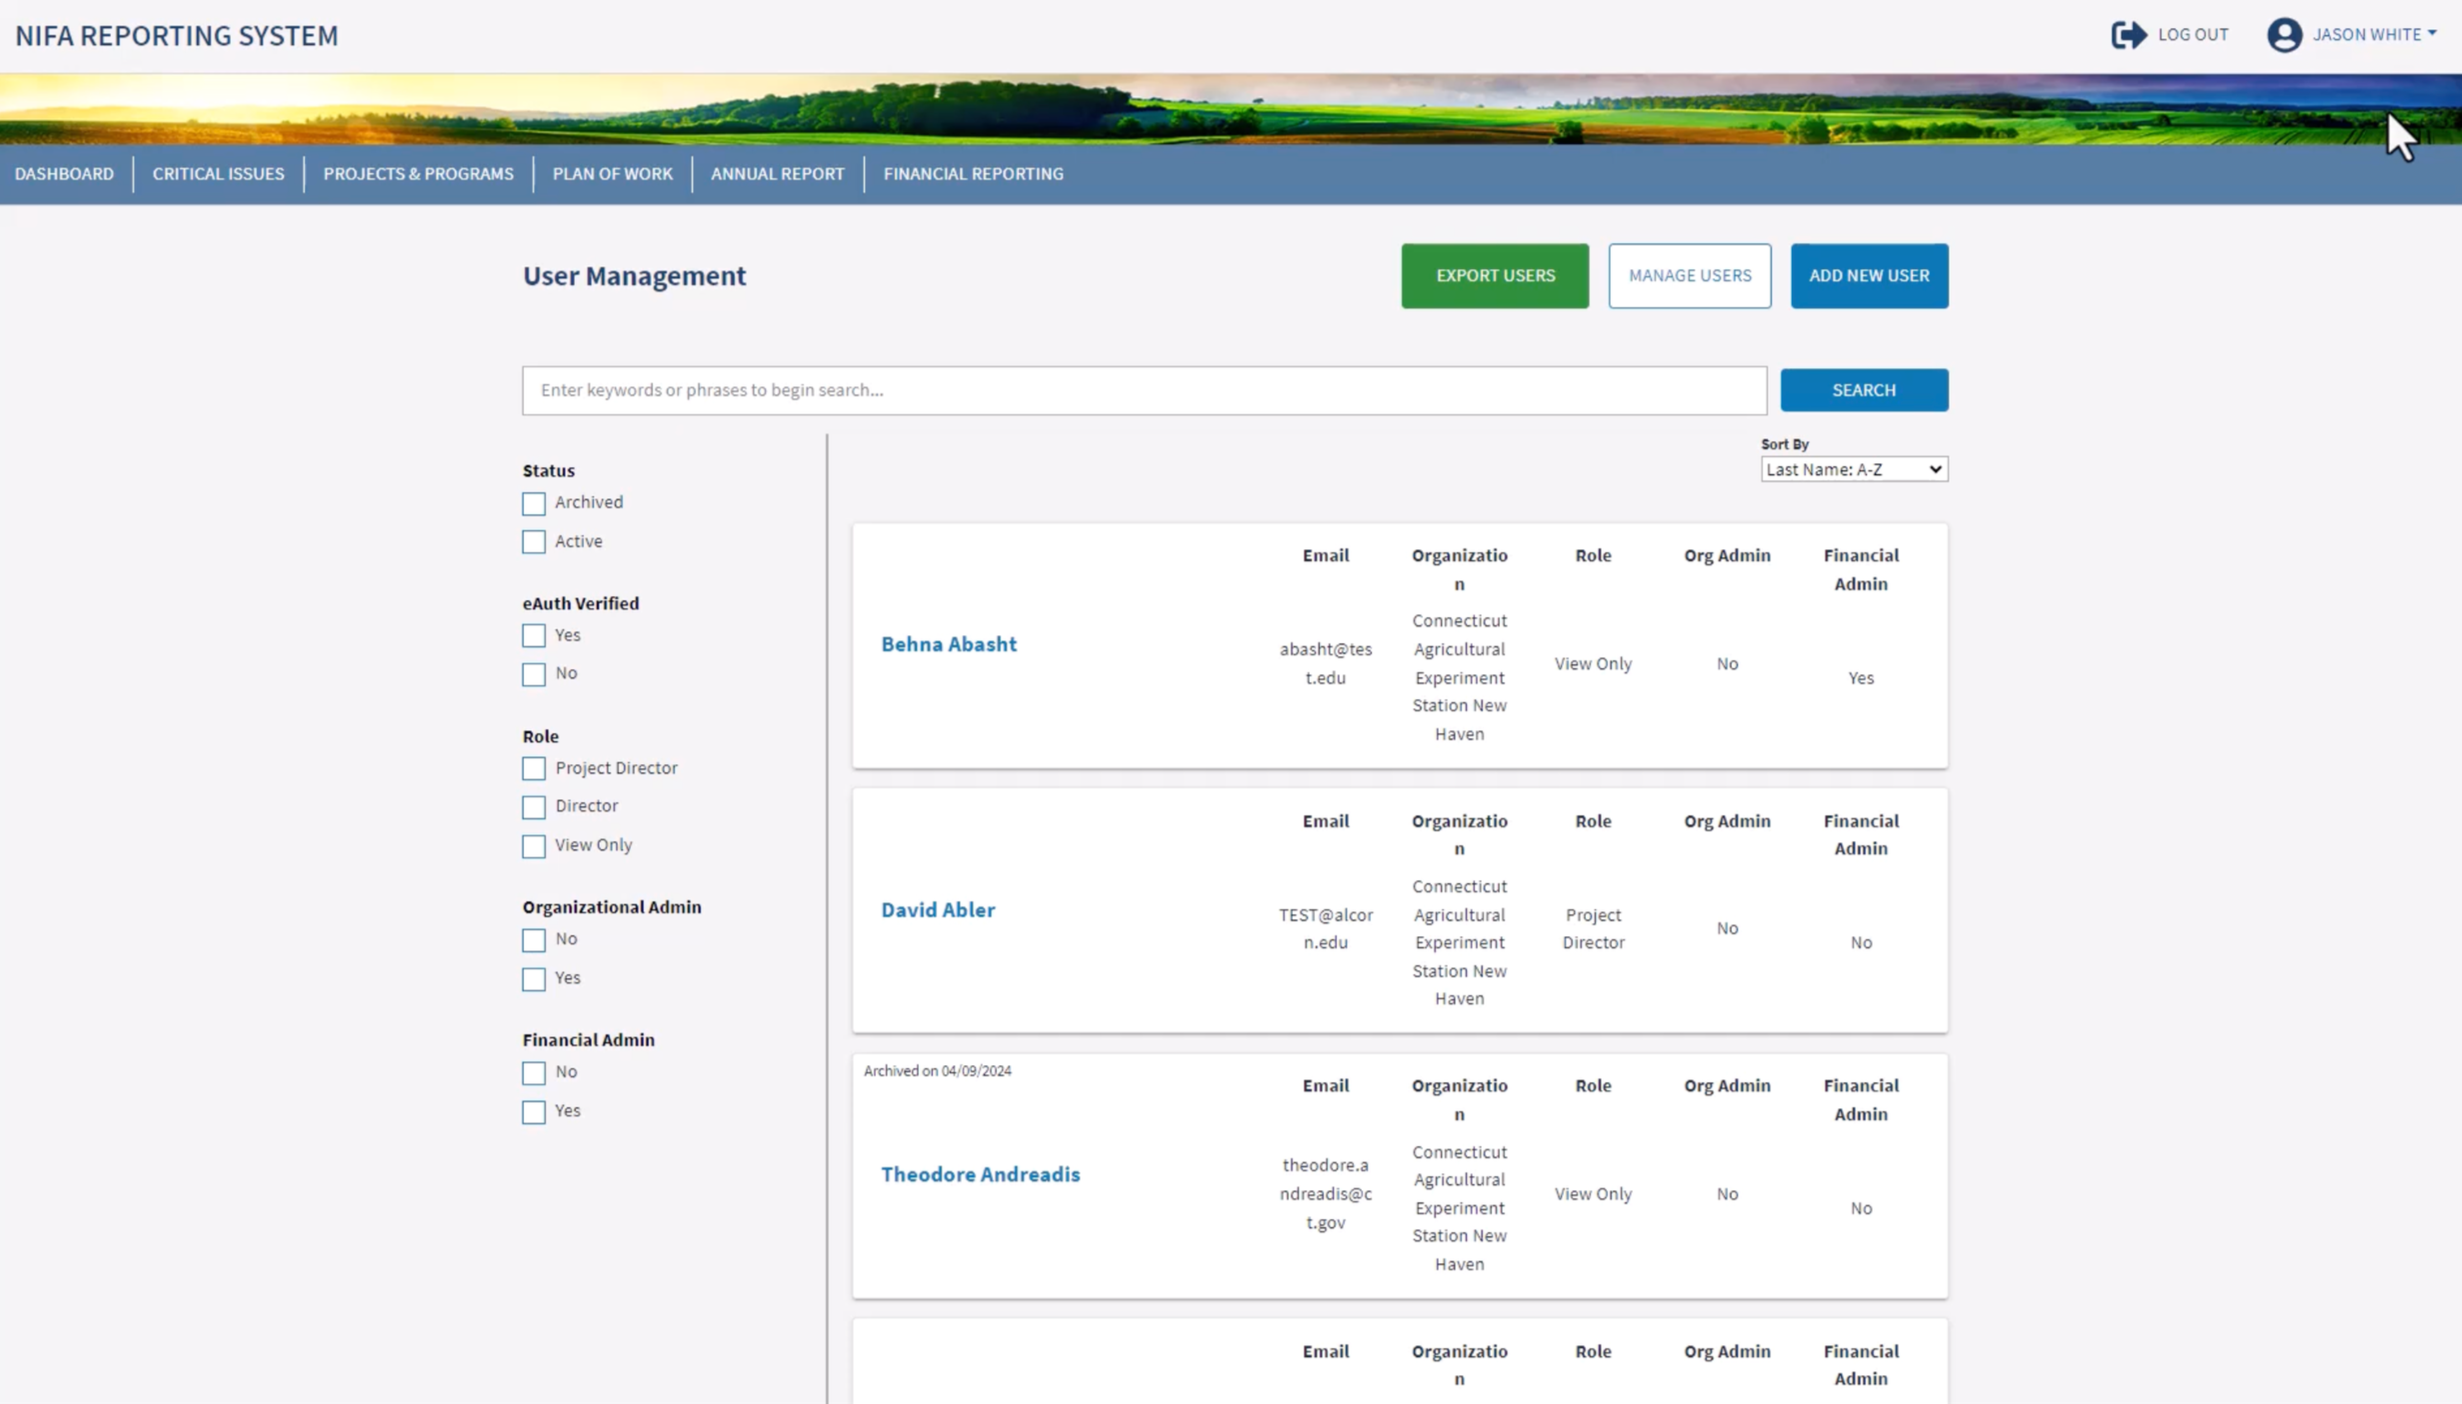
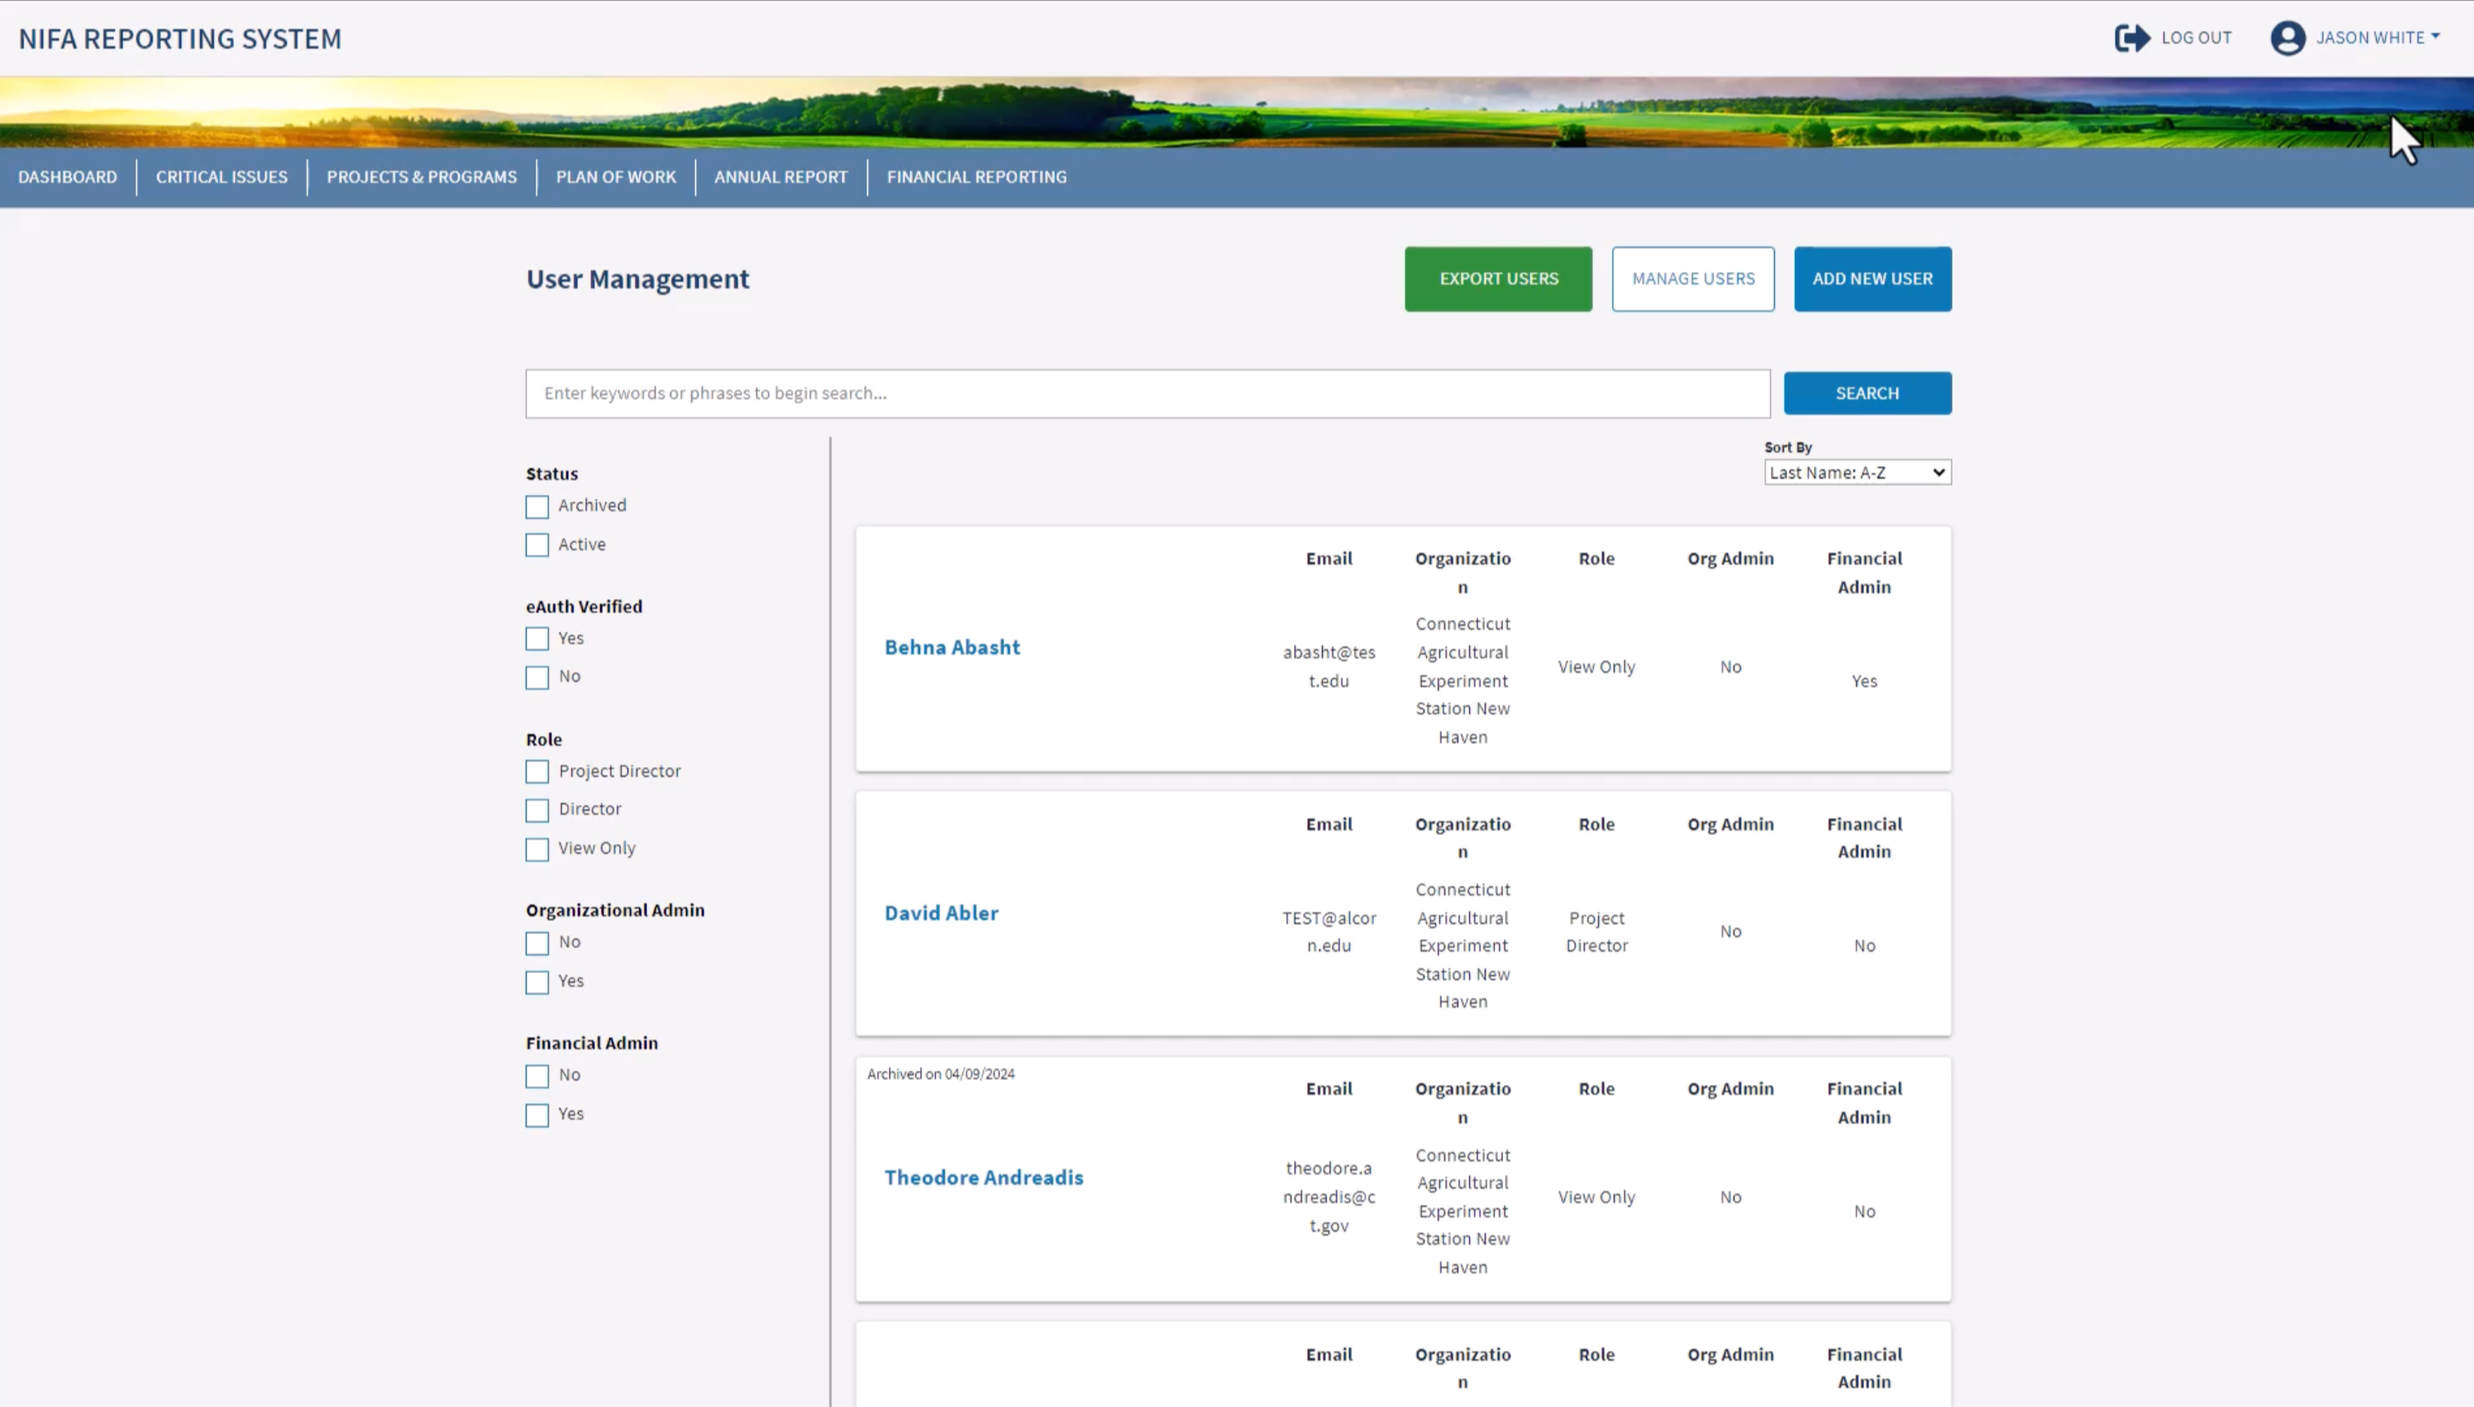
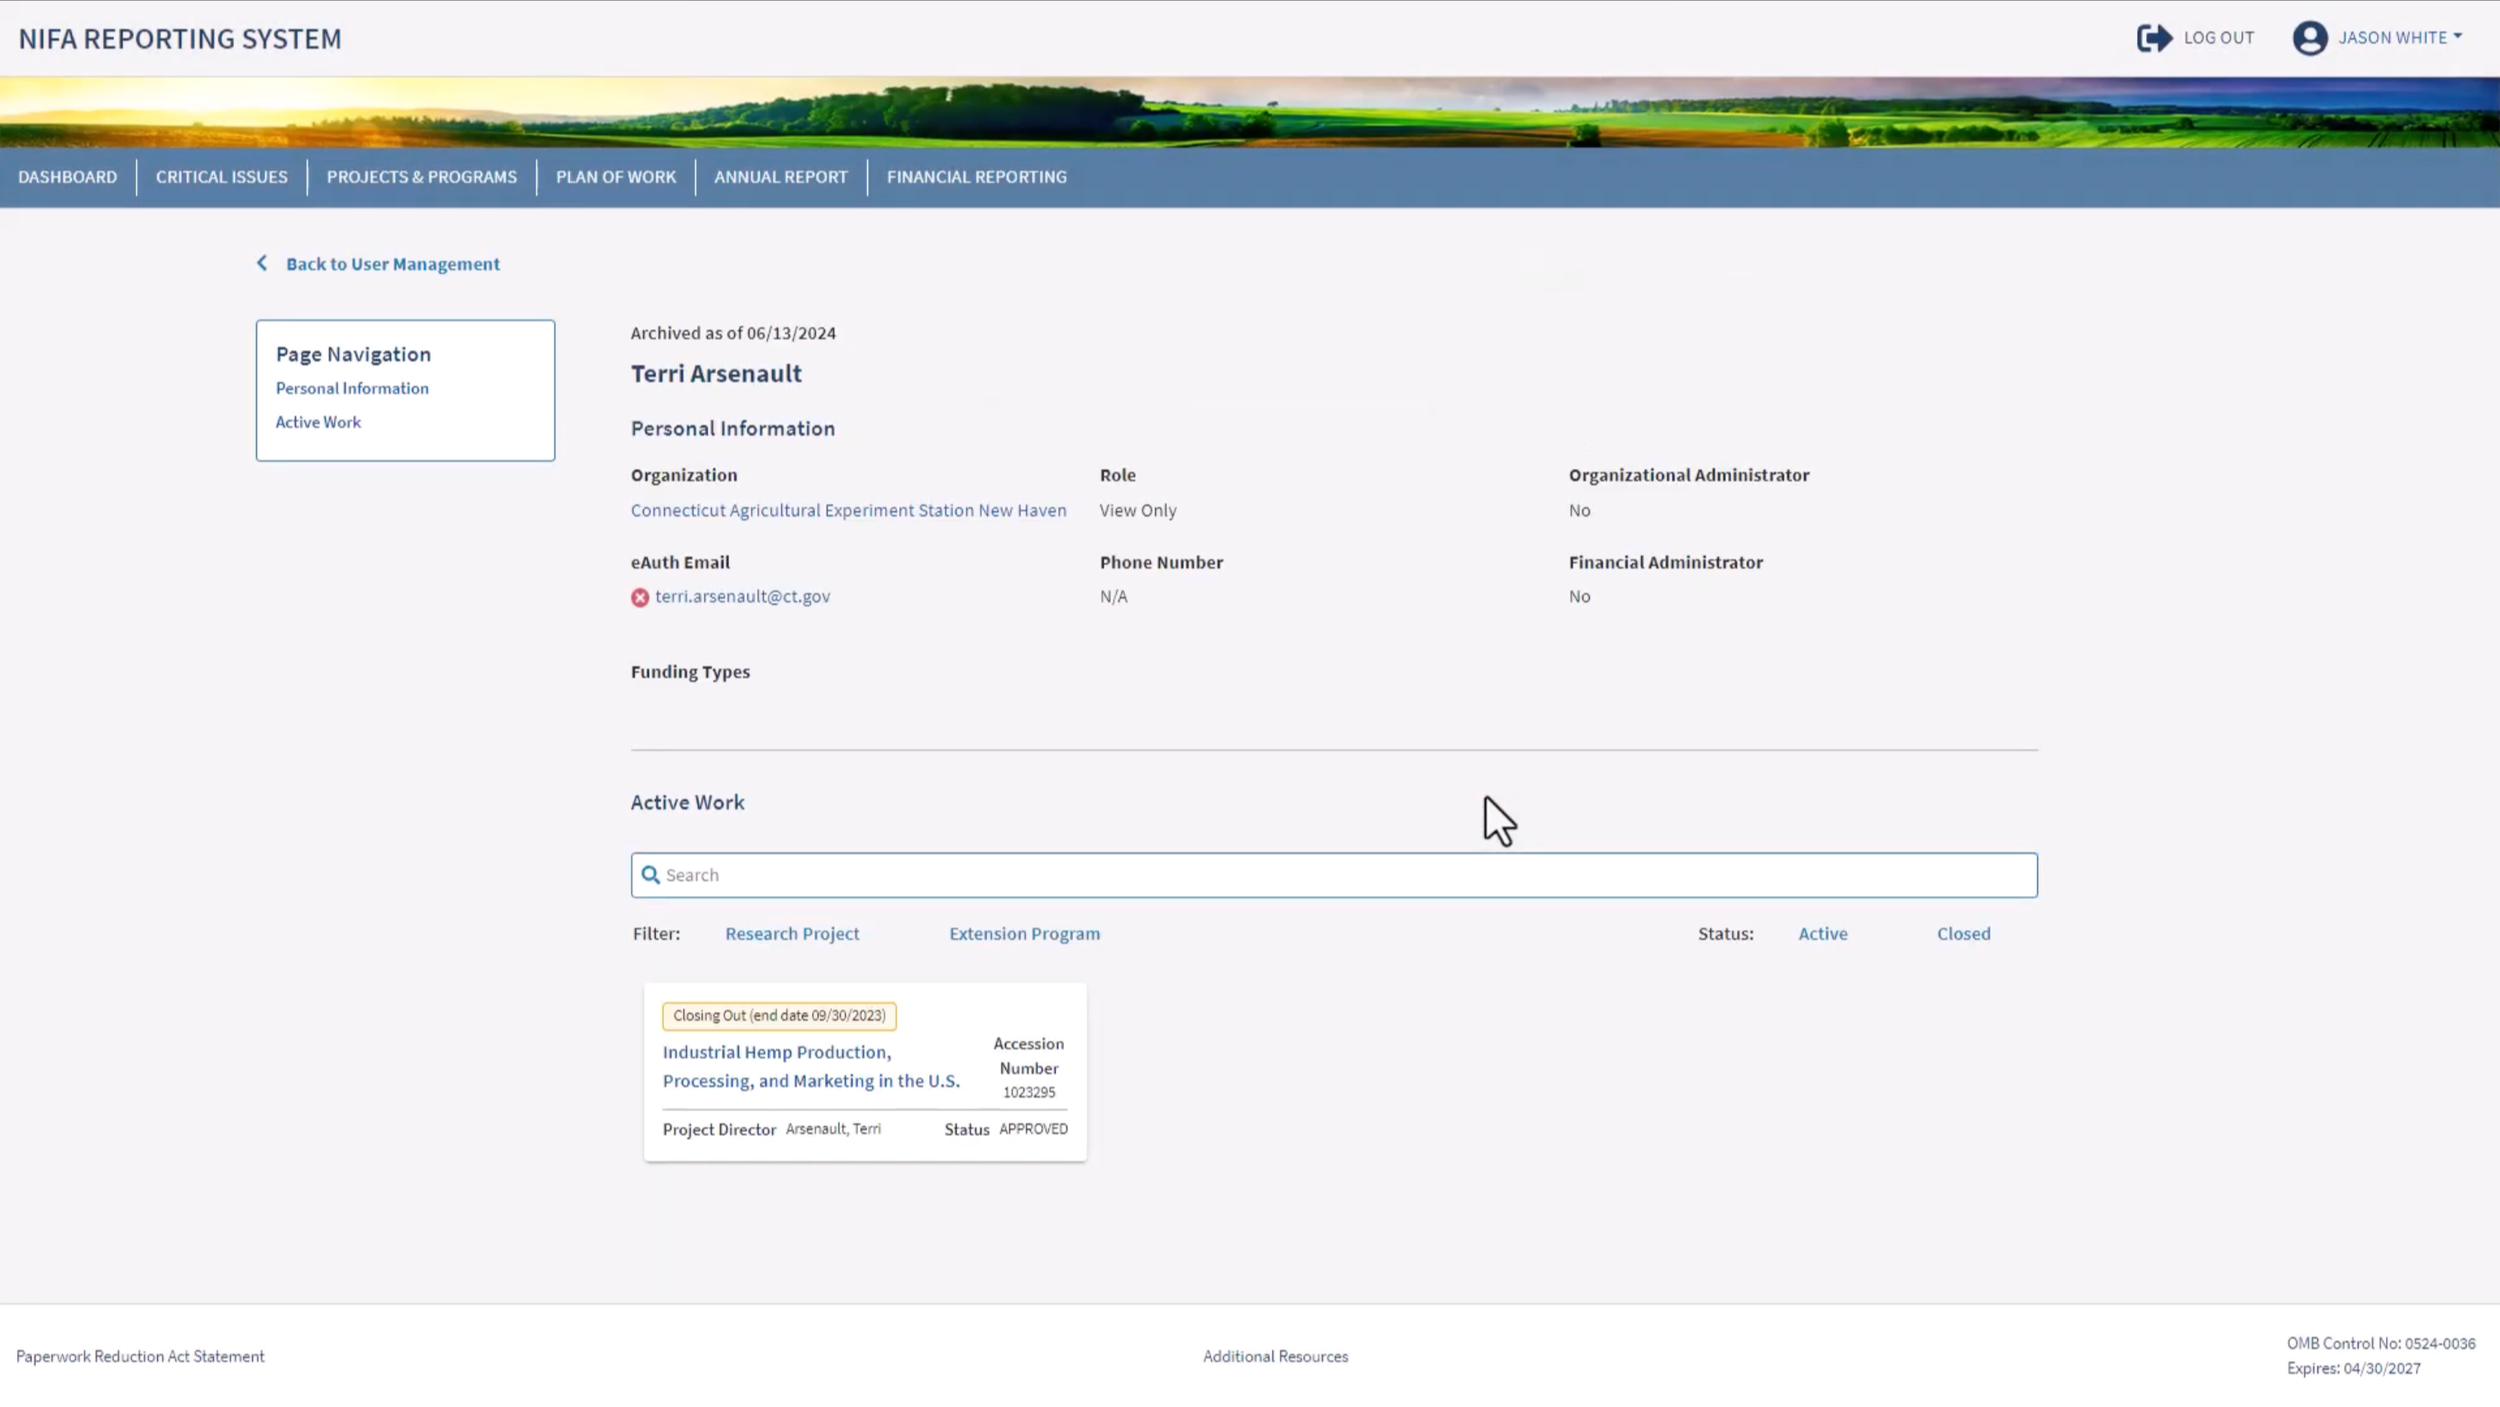
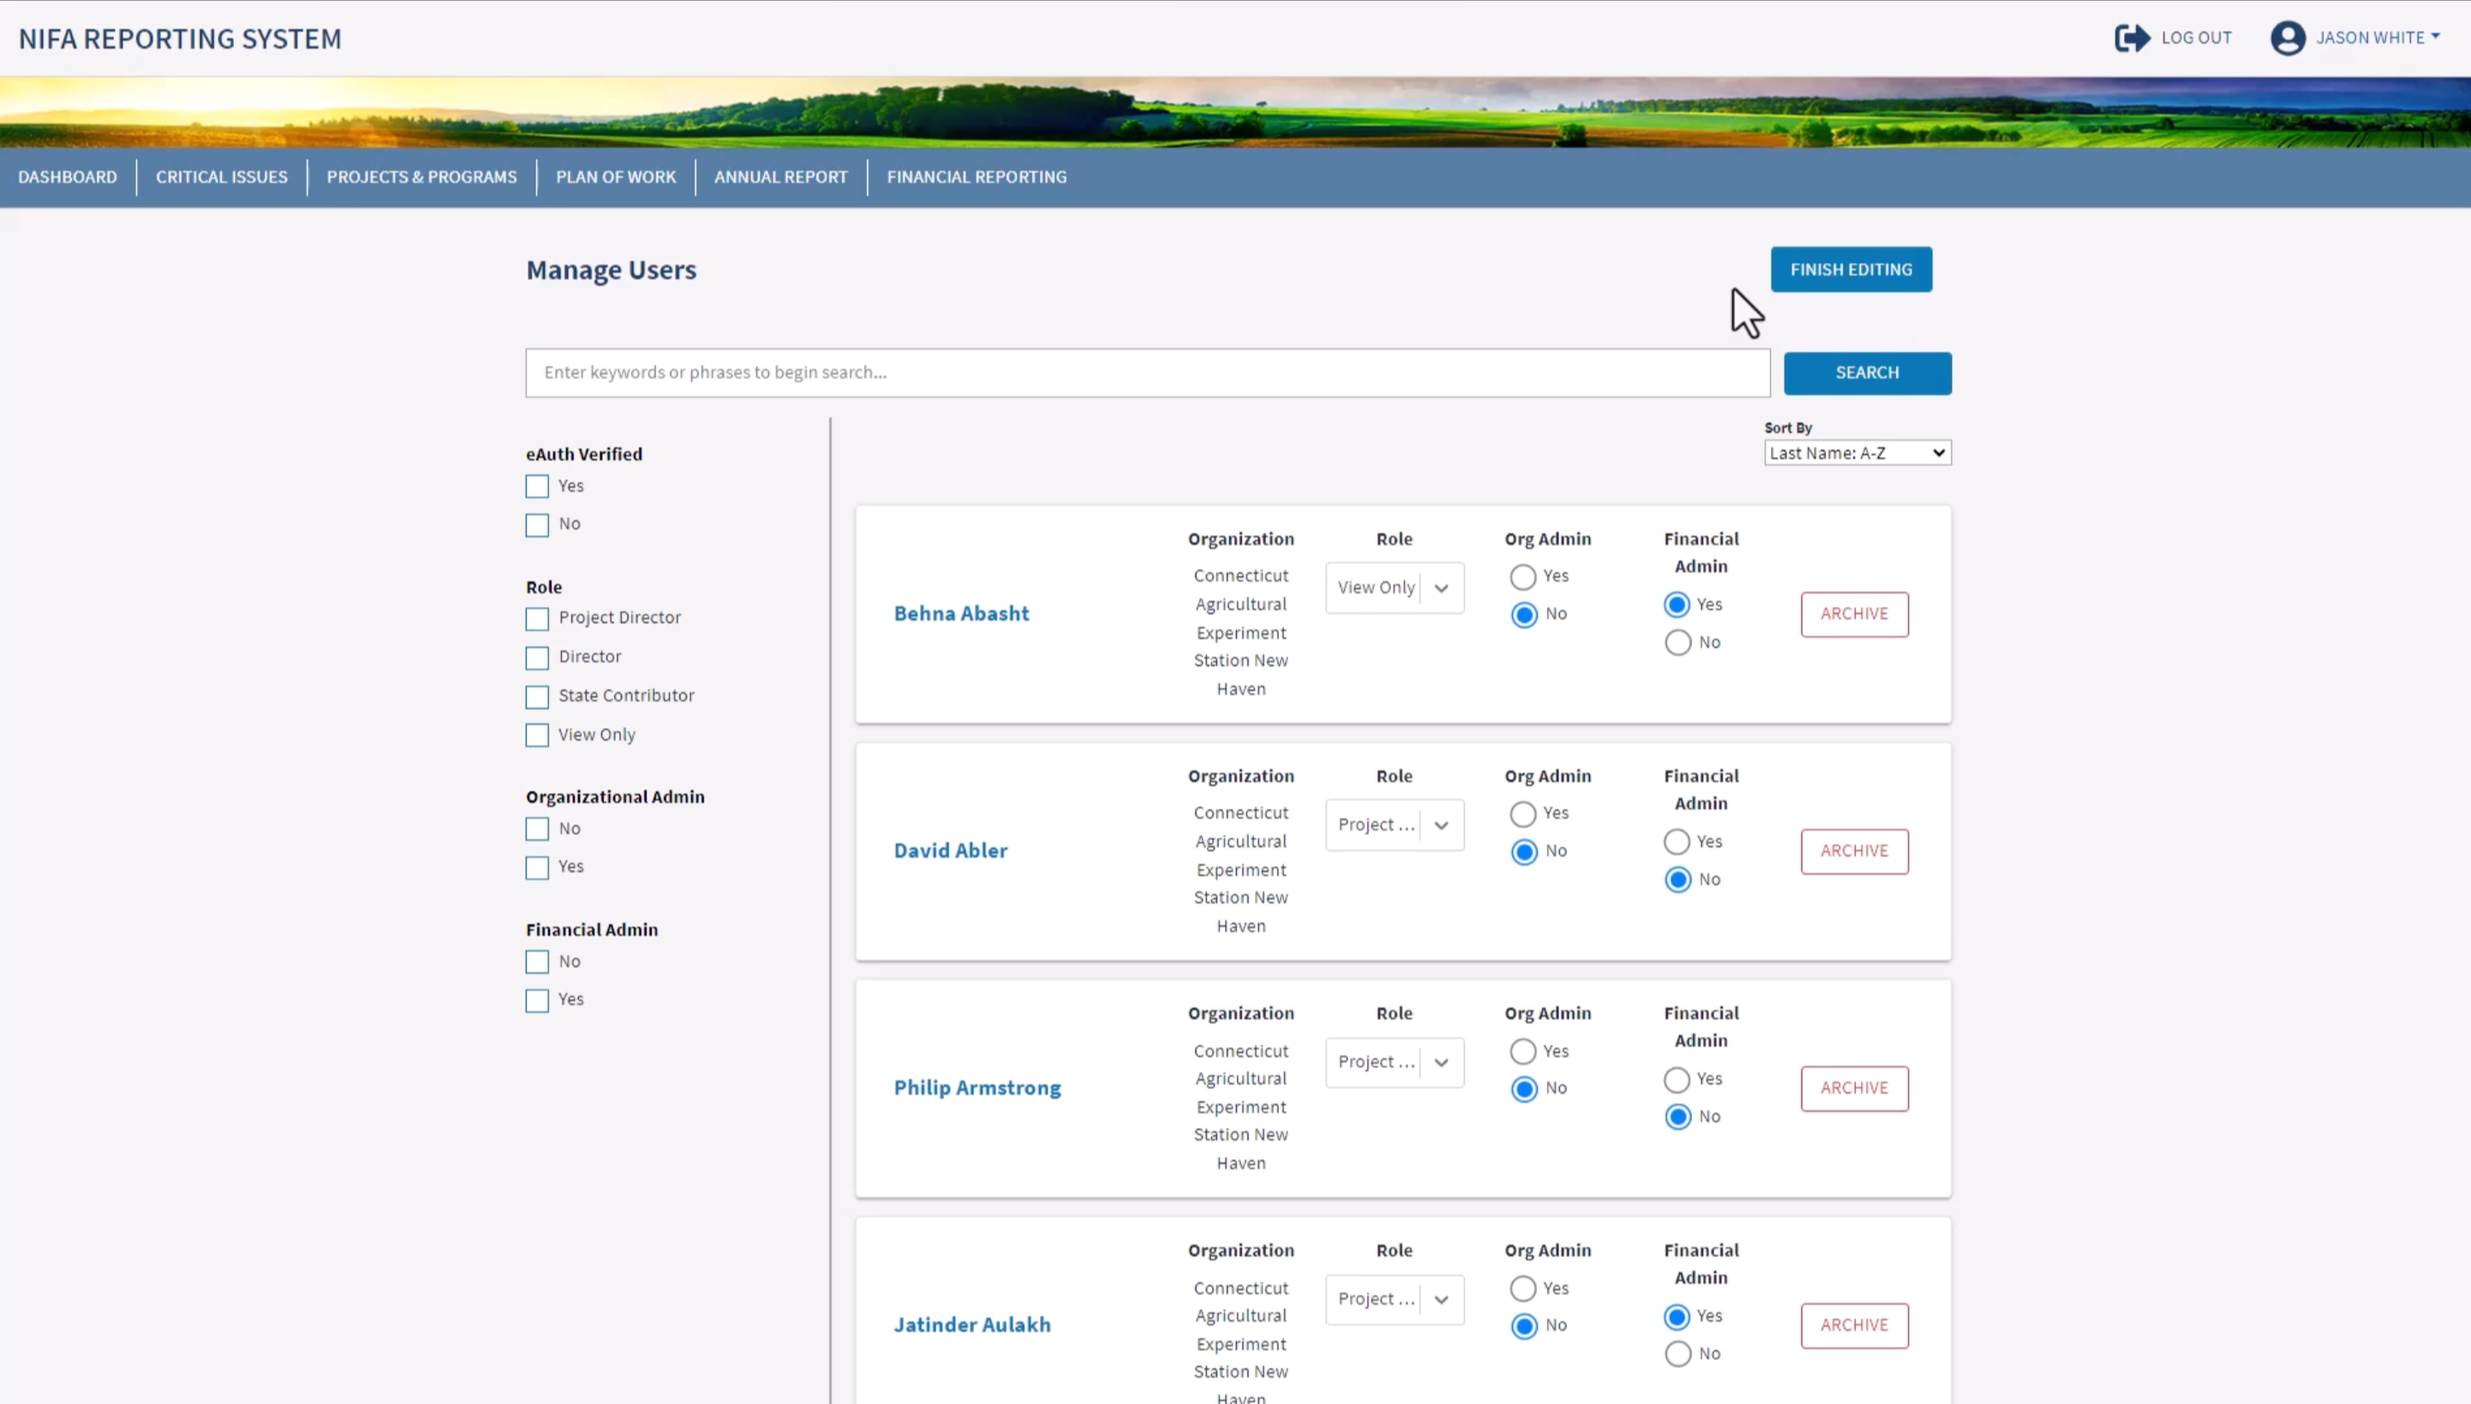
NRS User Management Experience
View a video walkthrough of this experience:
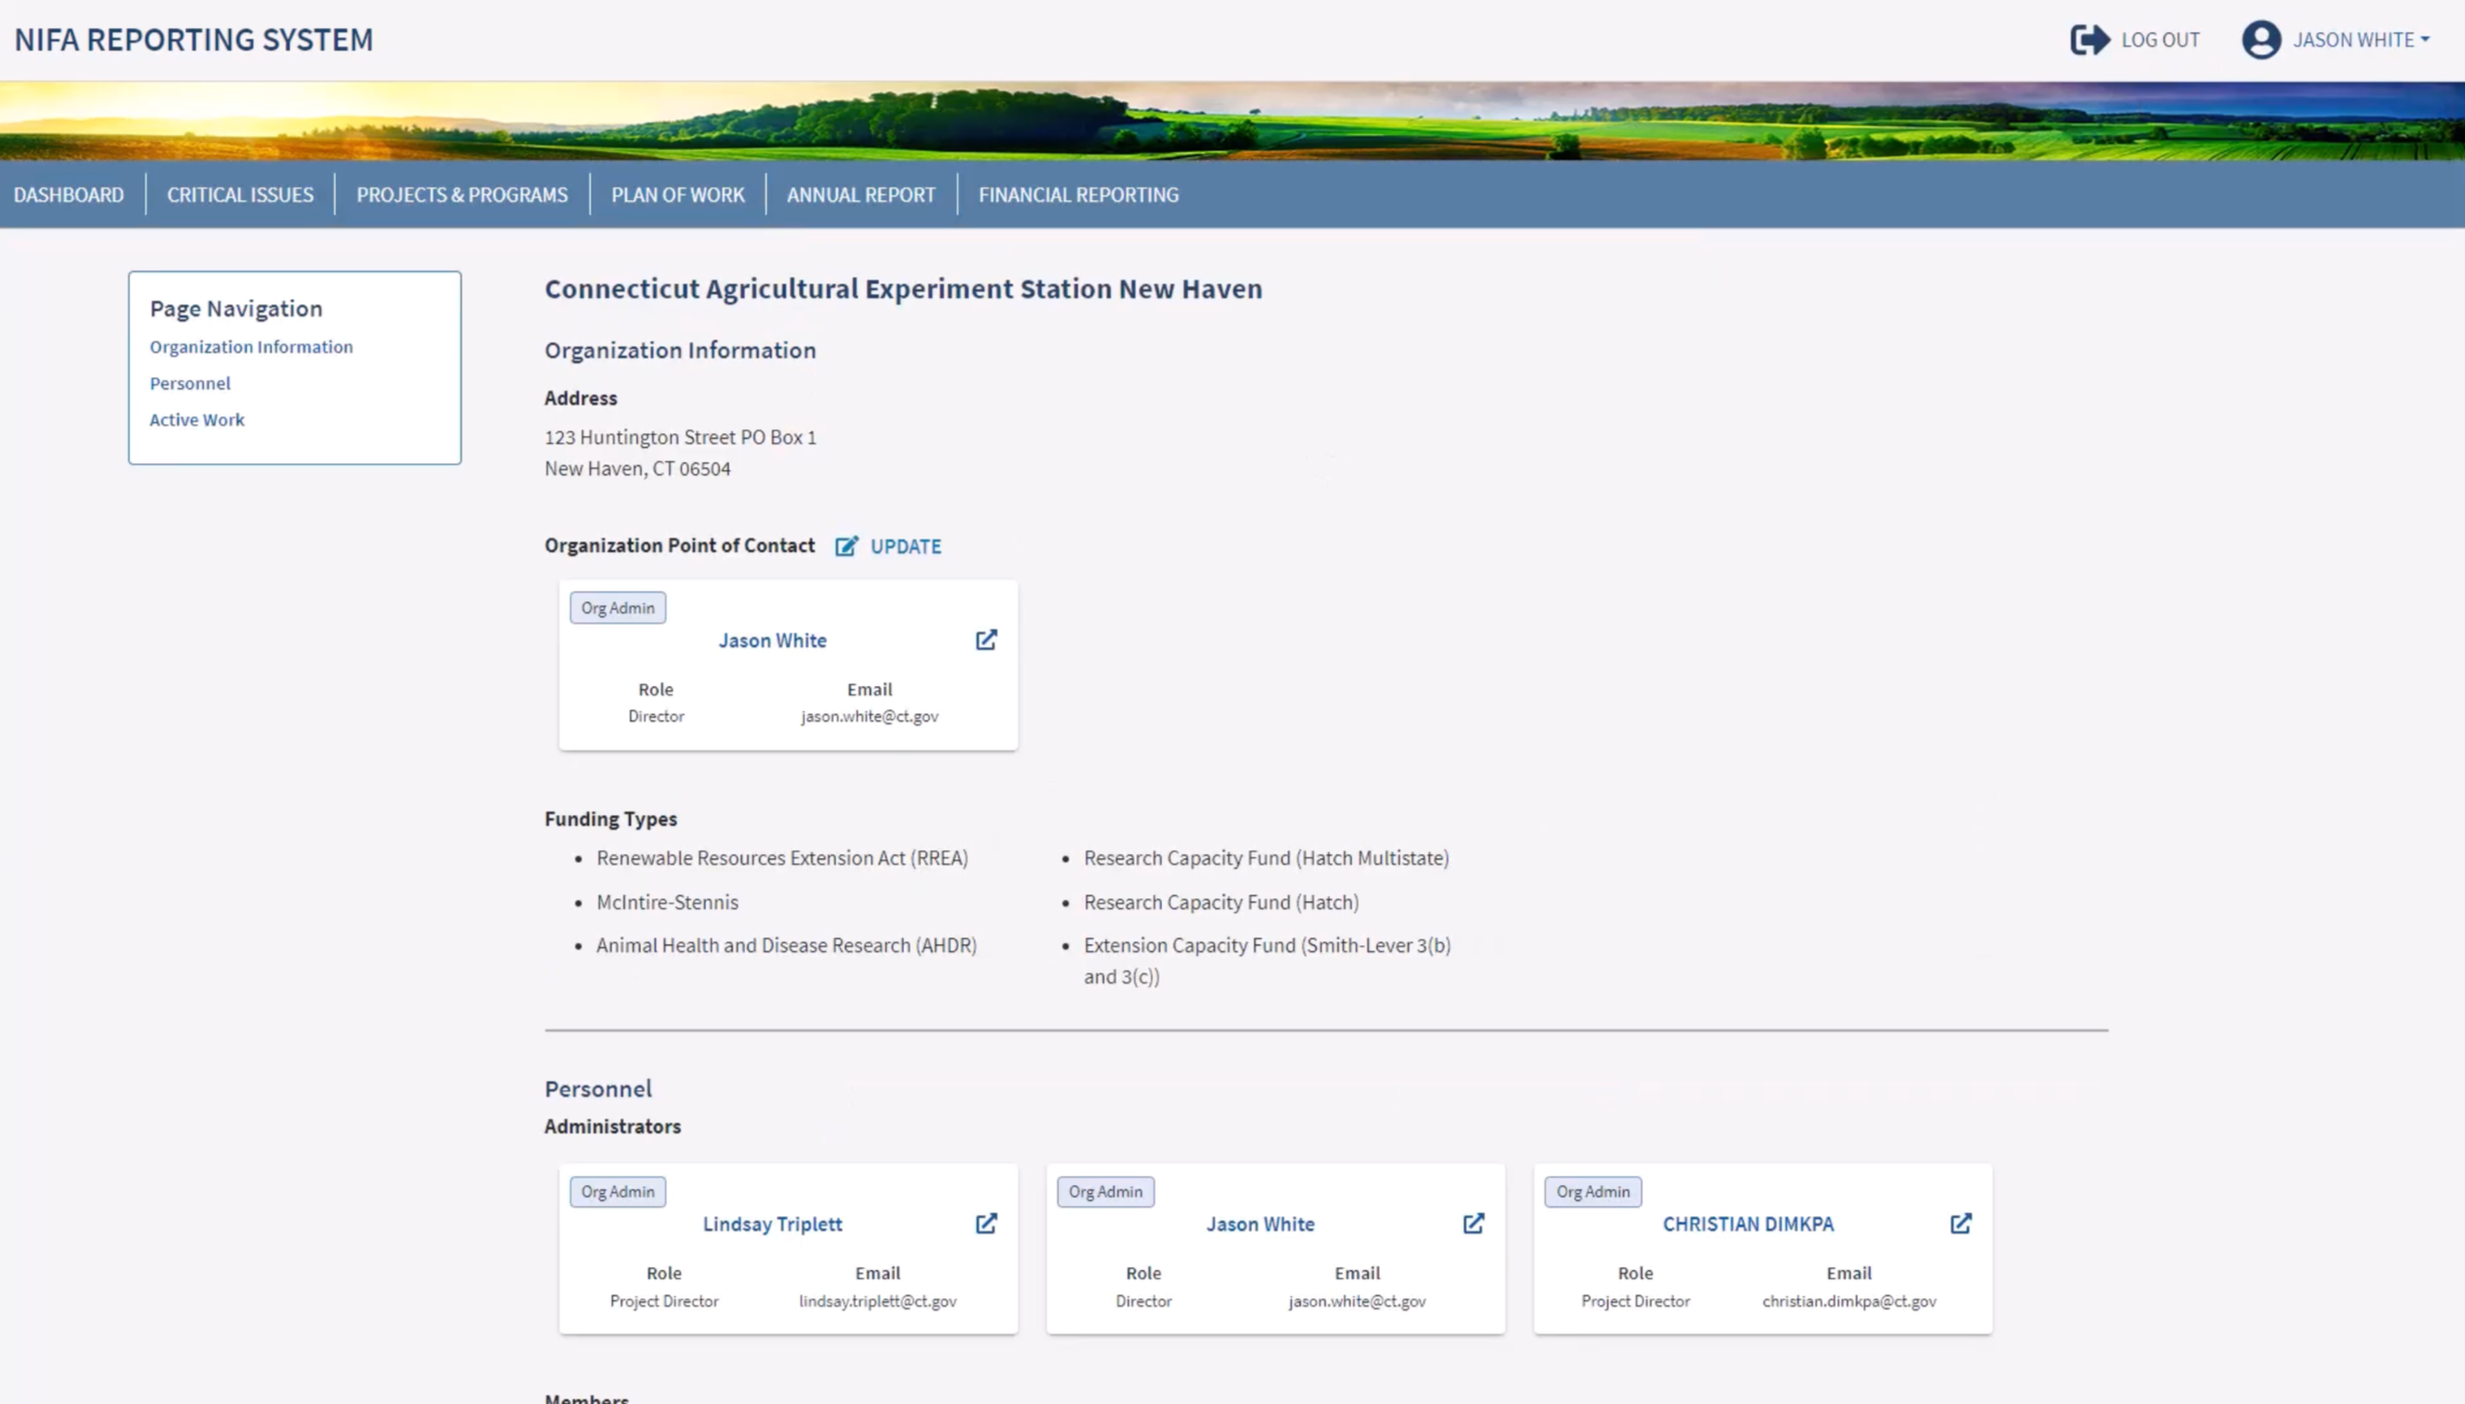
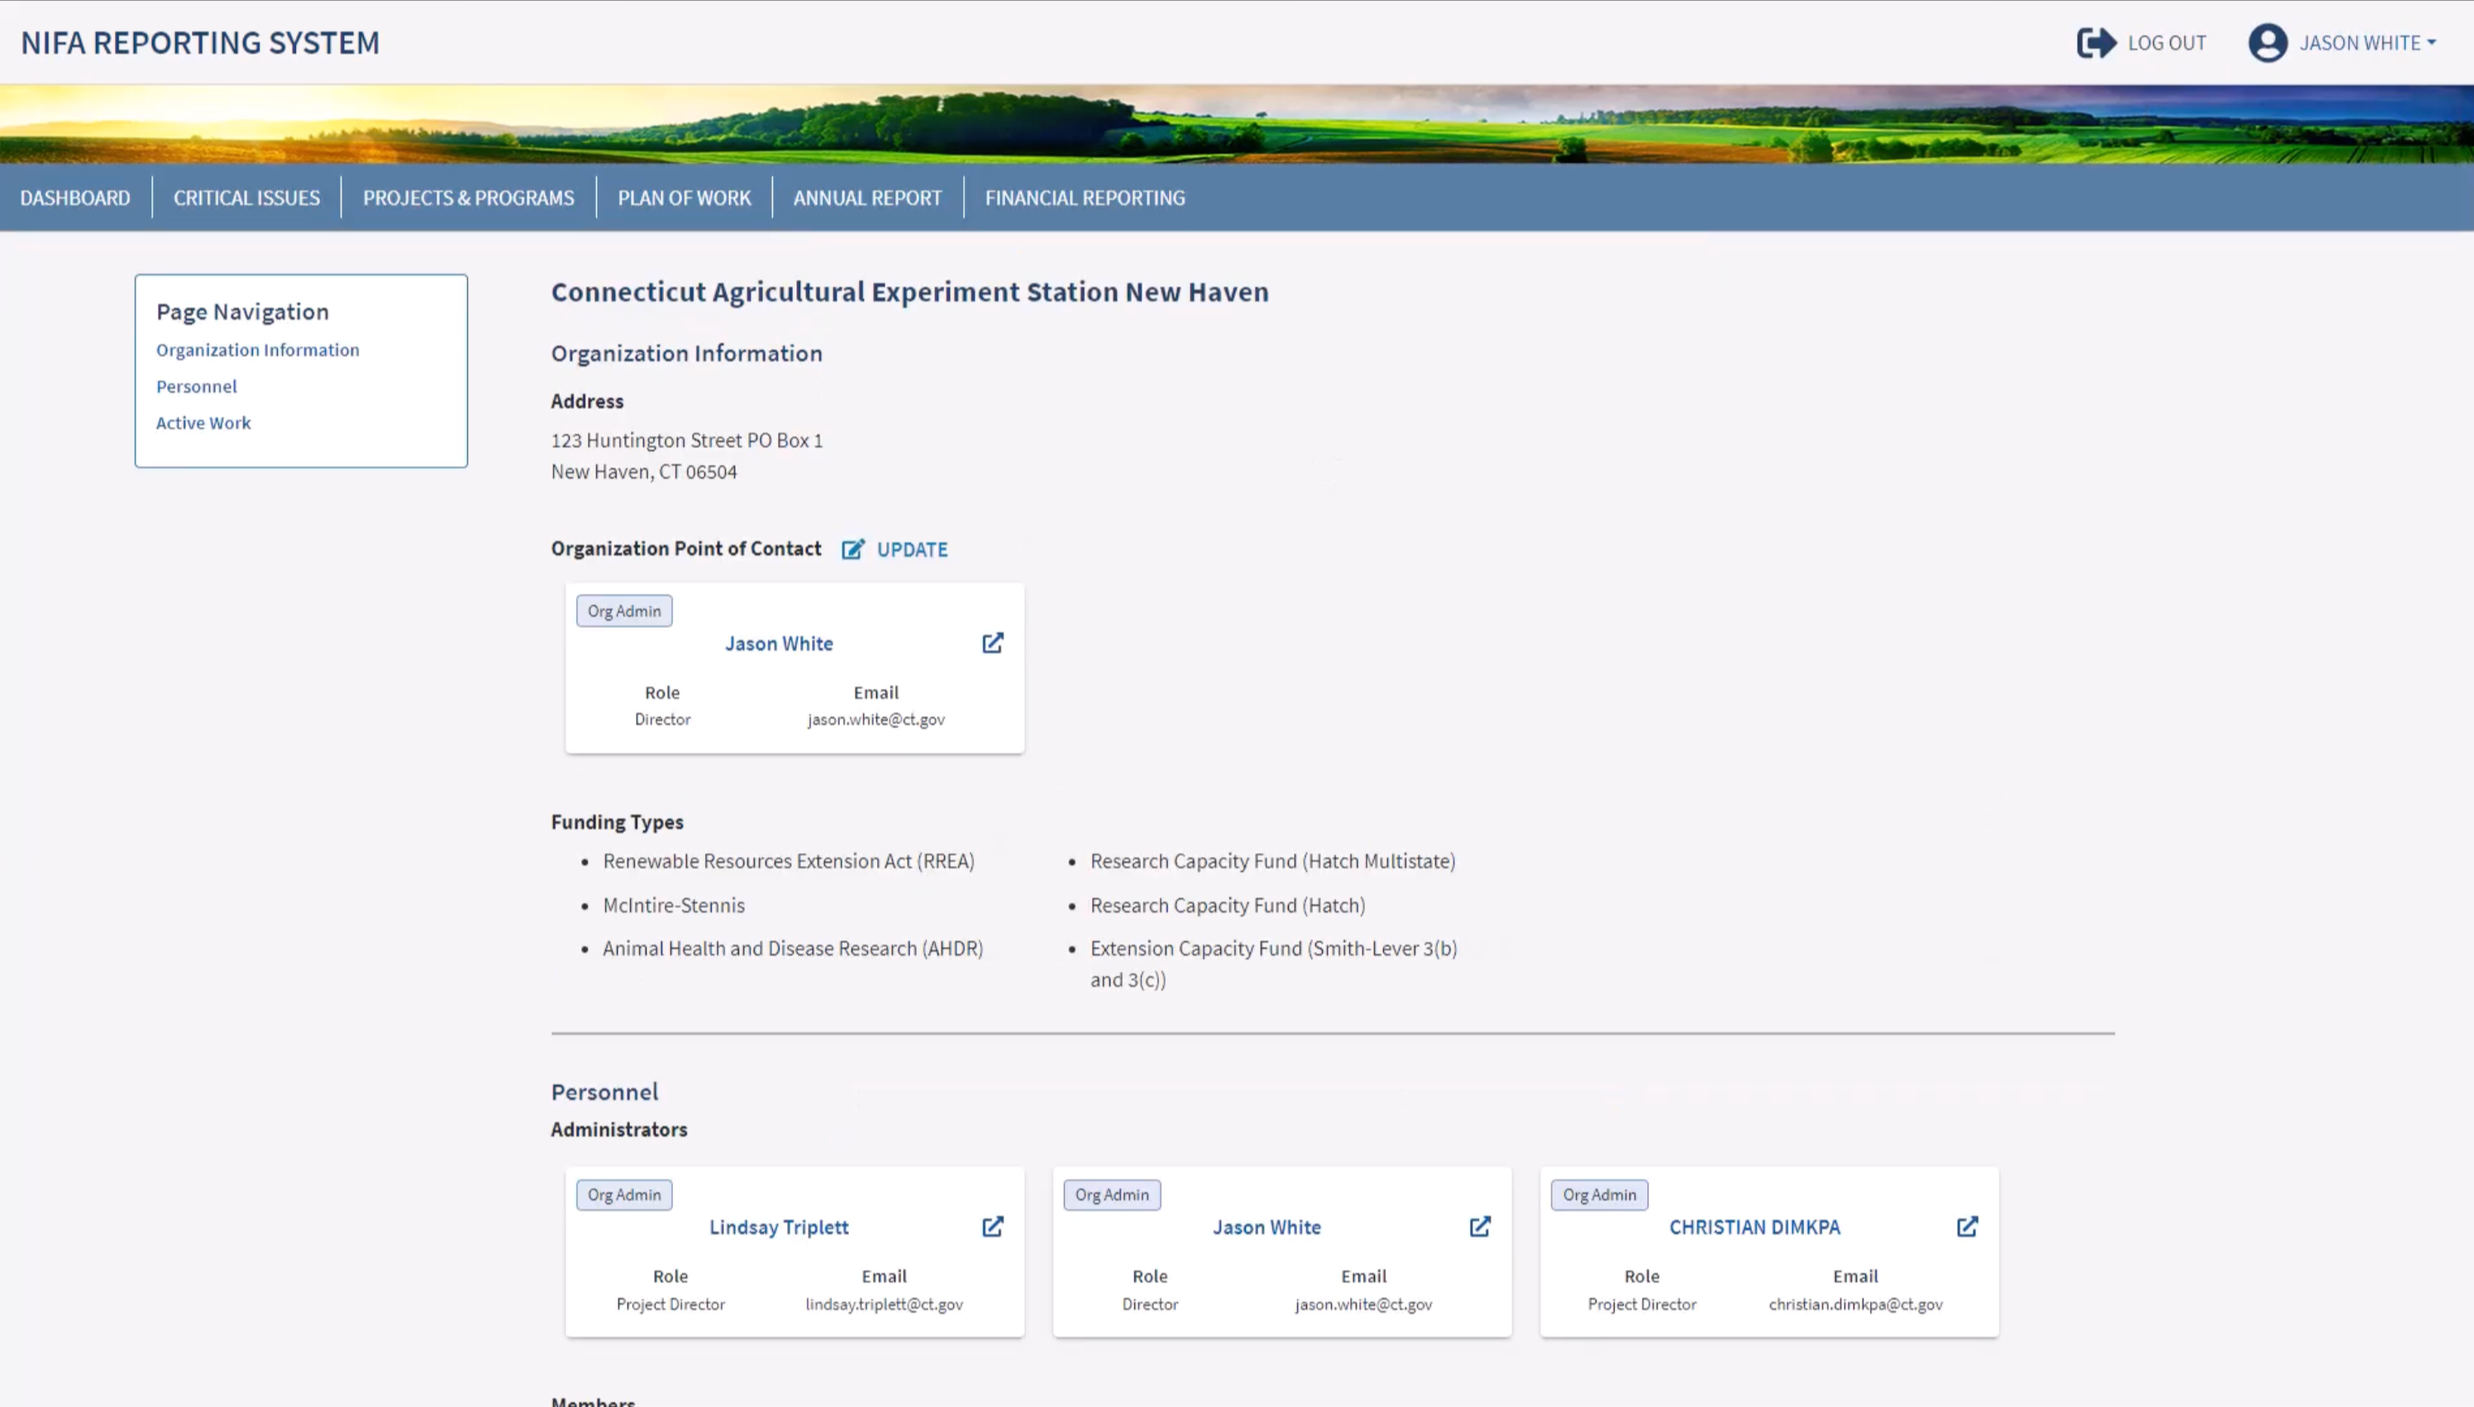
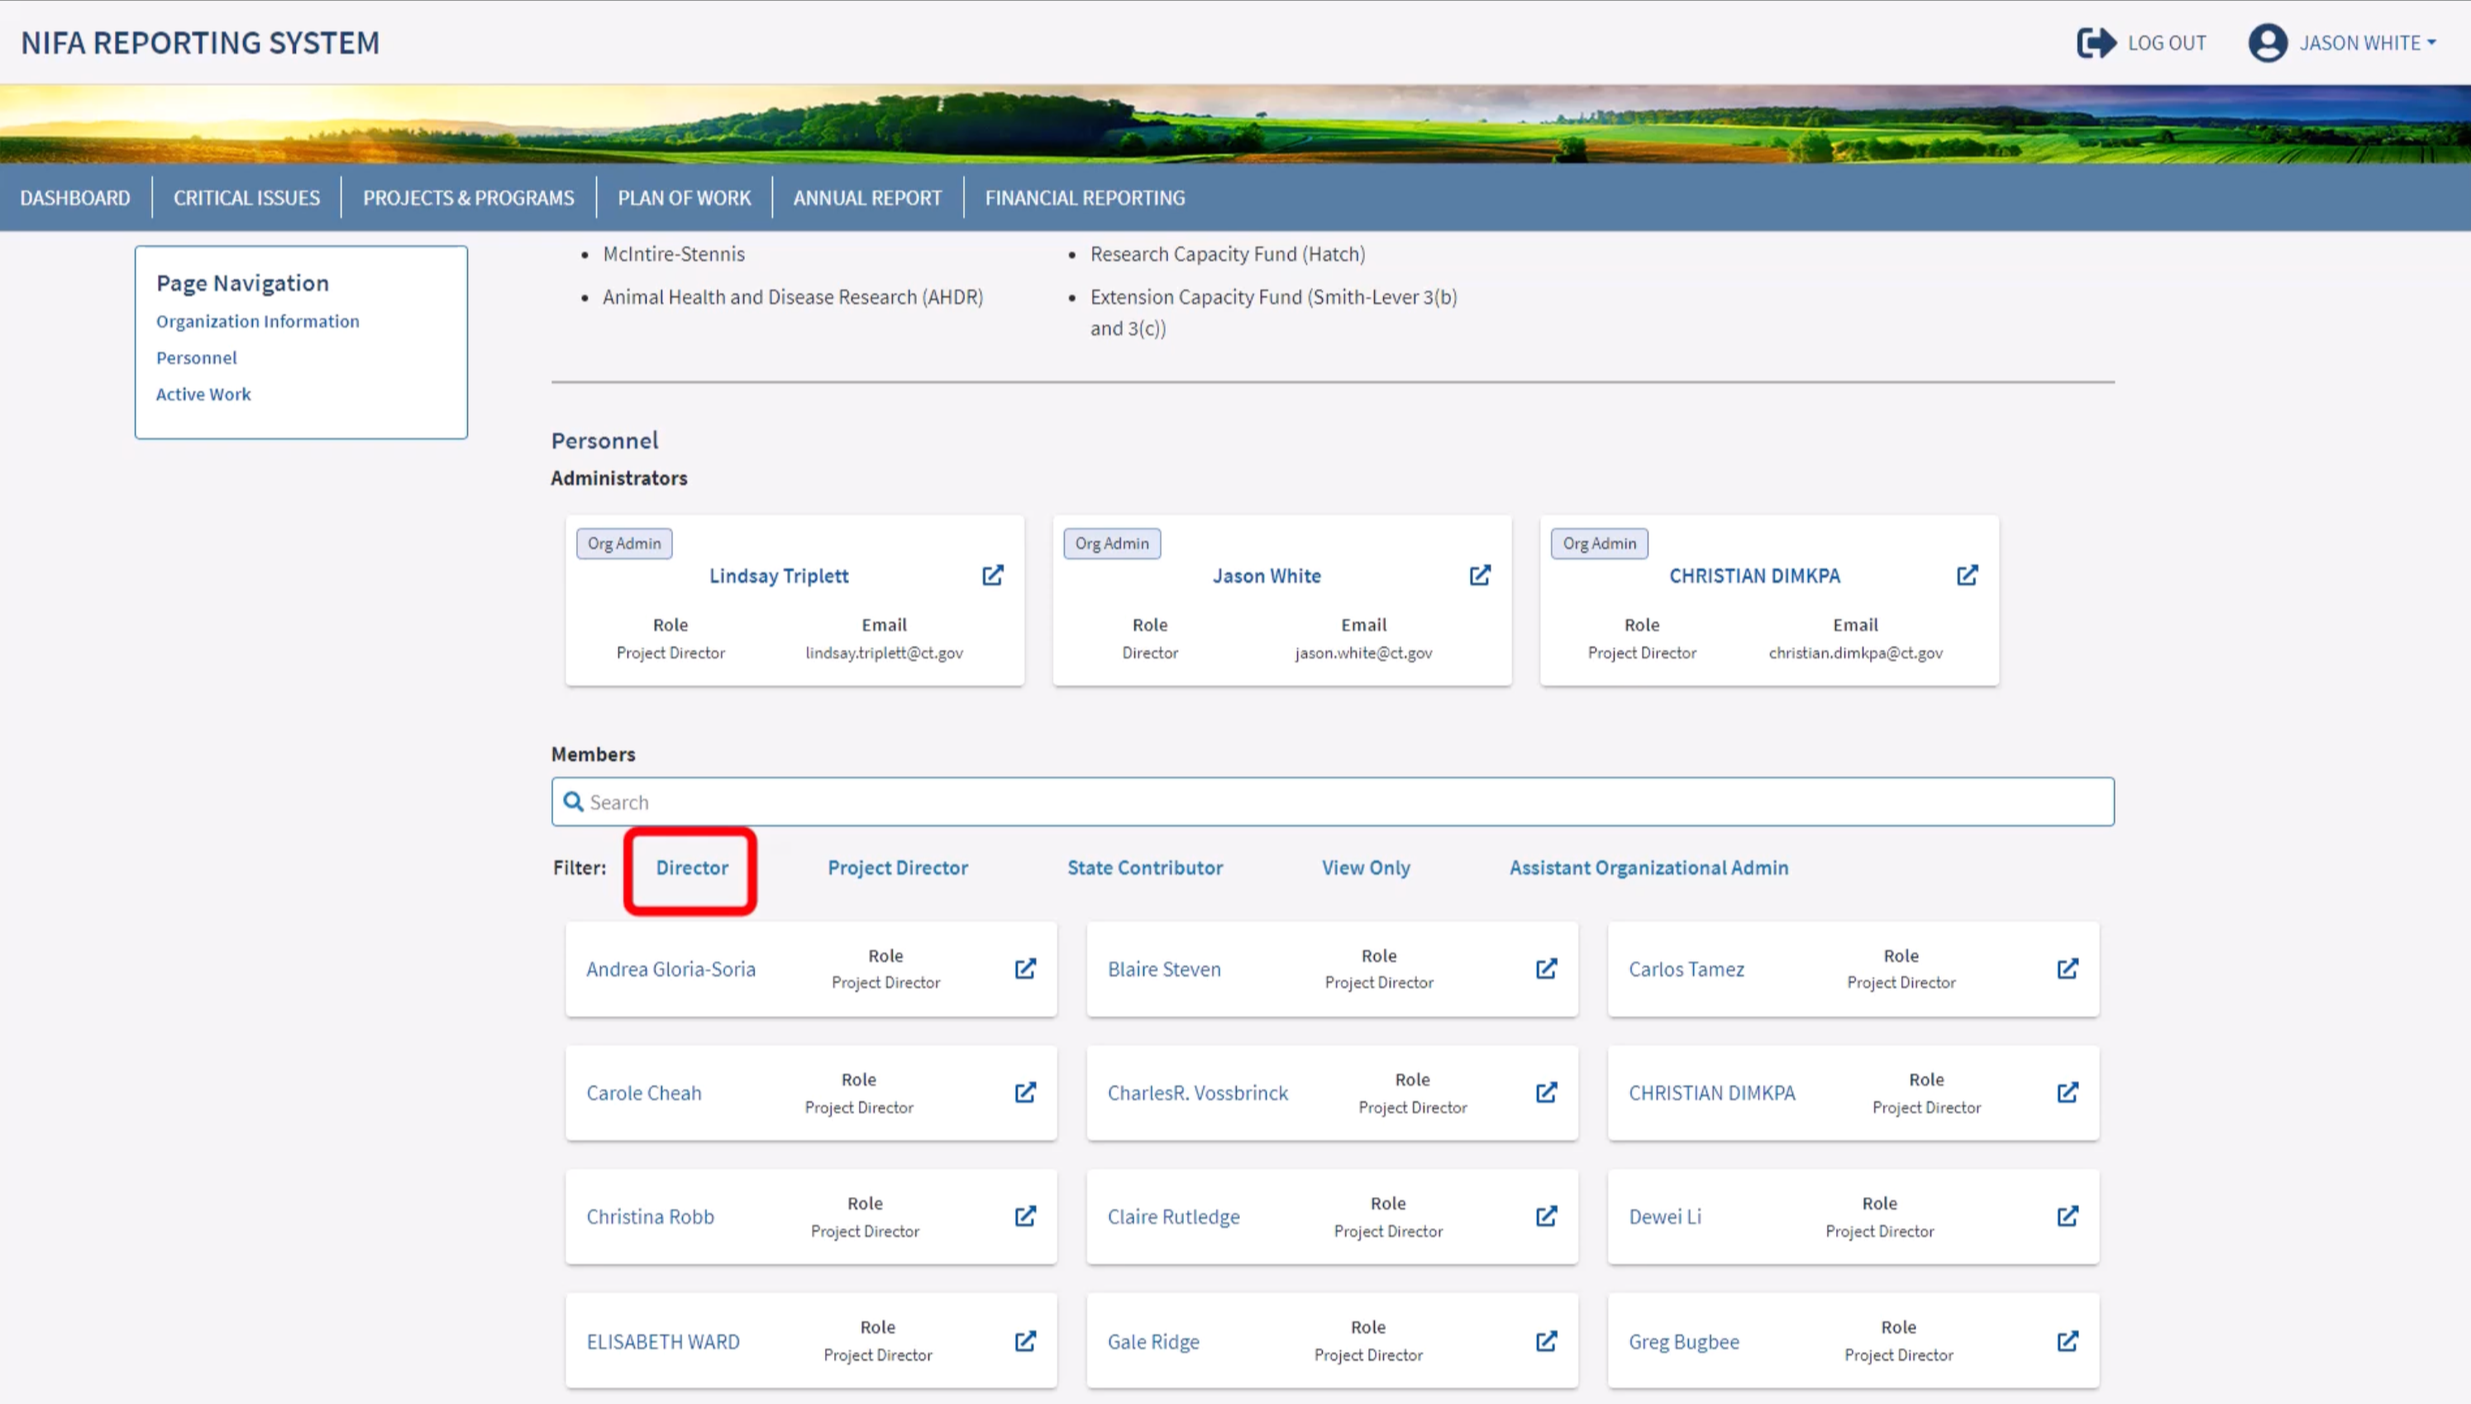
NRS Organization Management Experience
View a video walkthrough of this experience:
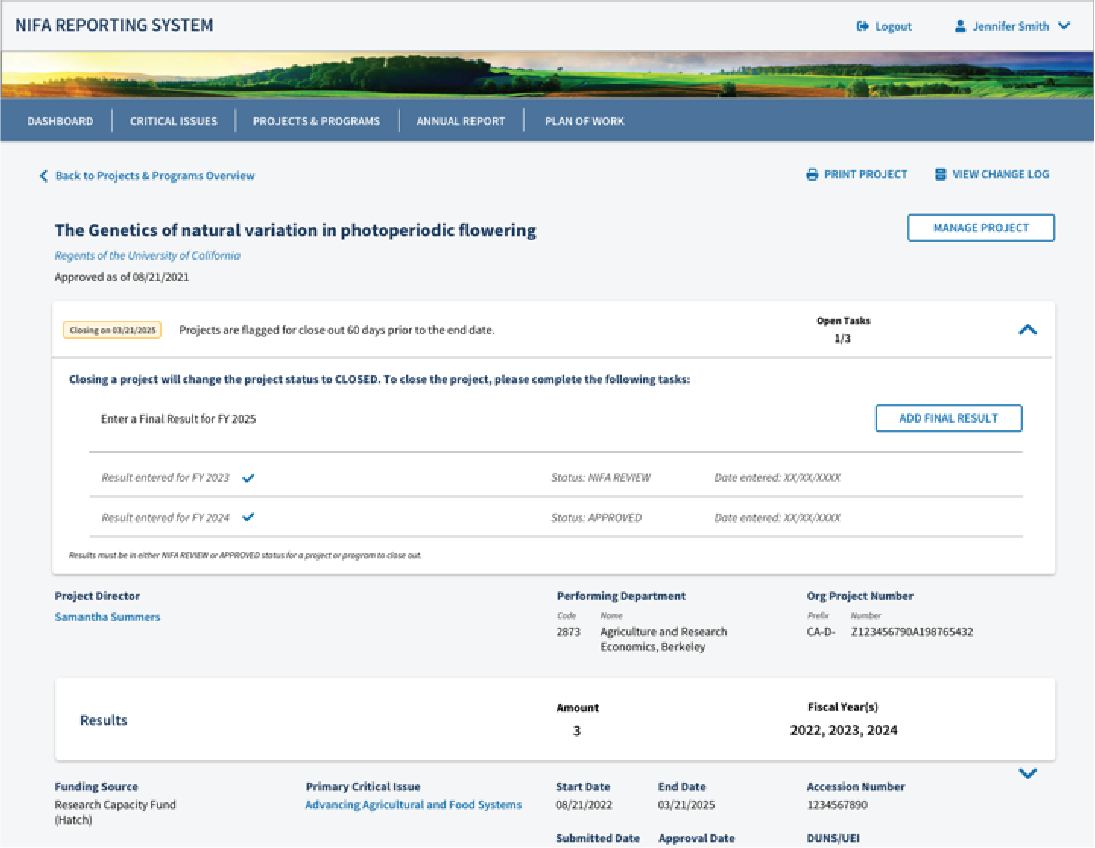
Project/Program Close-out Experience
